Licensed Appraiser
Realtor/Agent
Expert in properties on acreage and Green Bluff Real Estate Specialist
OVERALL GREEN BLUFF MARKET AREA CONDITIONS
The data summarized below are from the competing market area for Green Bluff from the Spokane Multiple Listing Service (SMLS) over the last 12 months prior to the effective date of 12-31-2023.
Sales & Listings
Sales Volume
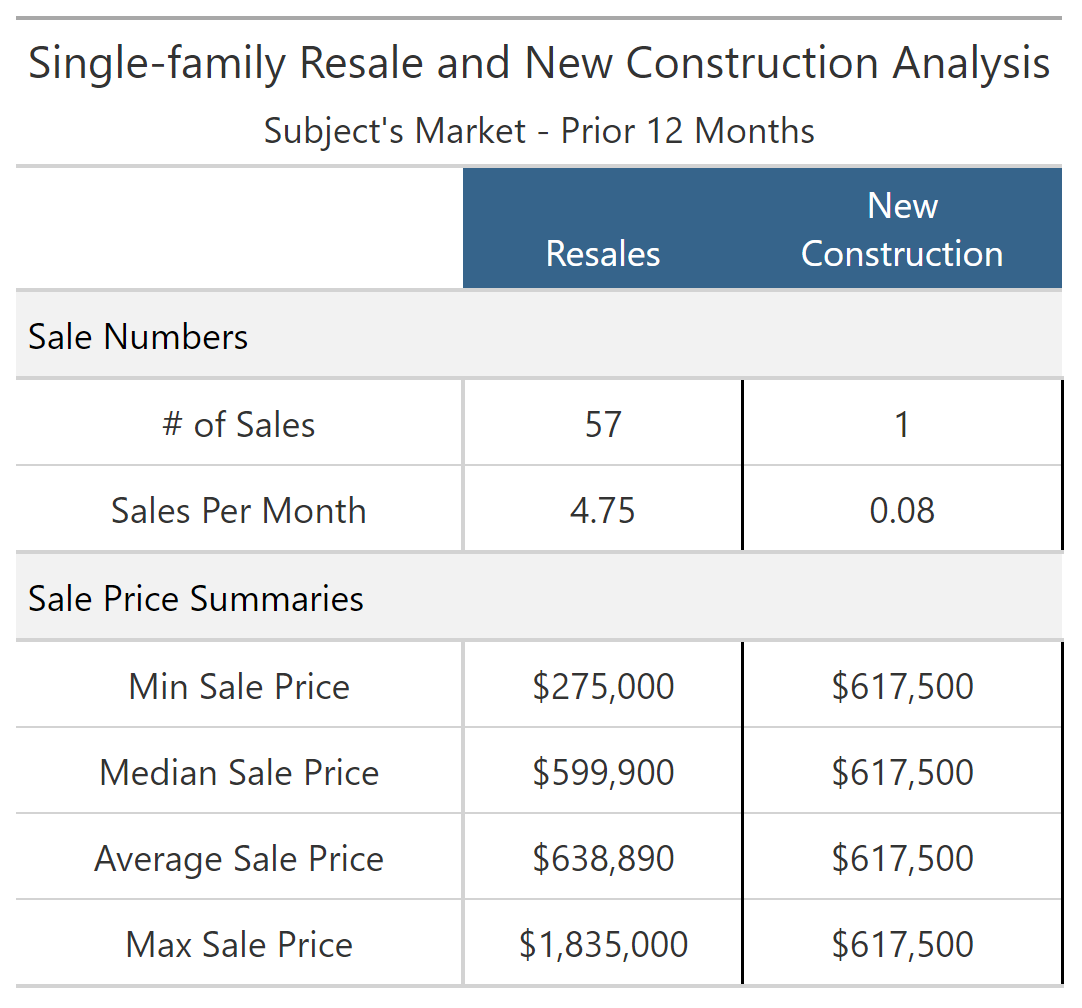
There were a total of 58 sales, which is 4.83 sales per month. Of these total sales, there were 0 distressed sales (bank owned, short-sale) reported in the Spokane Multiple Listing Service (SMLS), and there were 58 non-distressed single-family sales.
Of these 58 non-distressed sales, 57 were resales, and 1 was a new construction sale.
The price summaries of these sales are in the following table:
Listing Activity
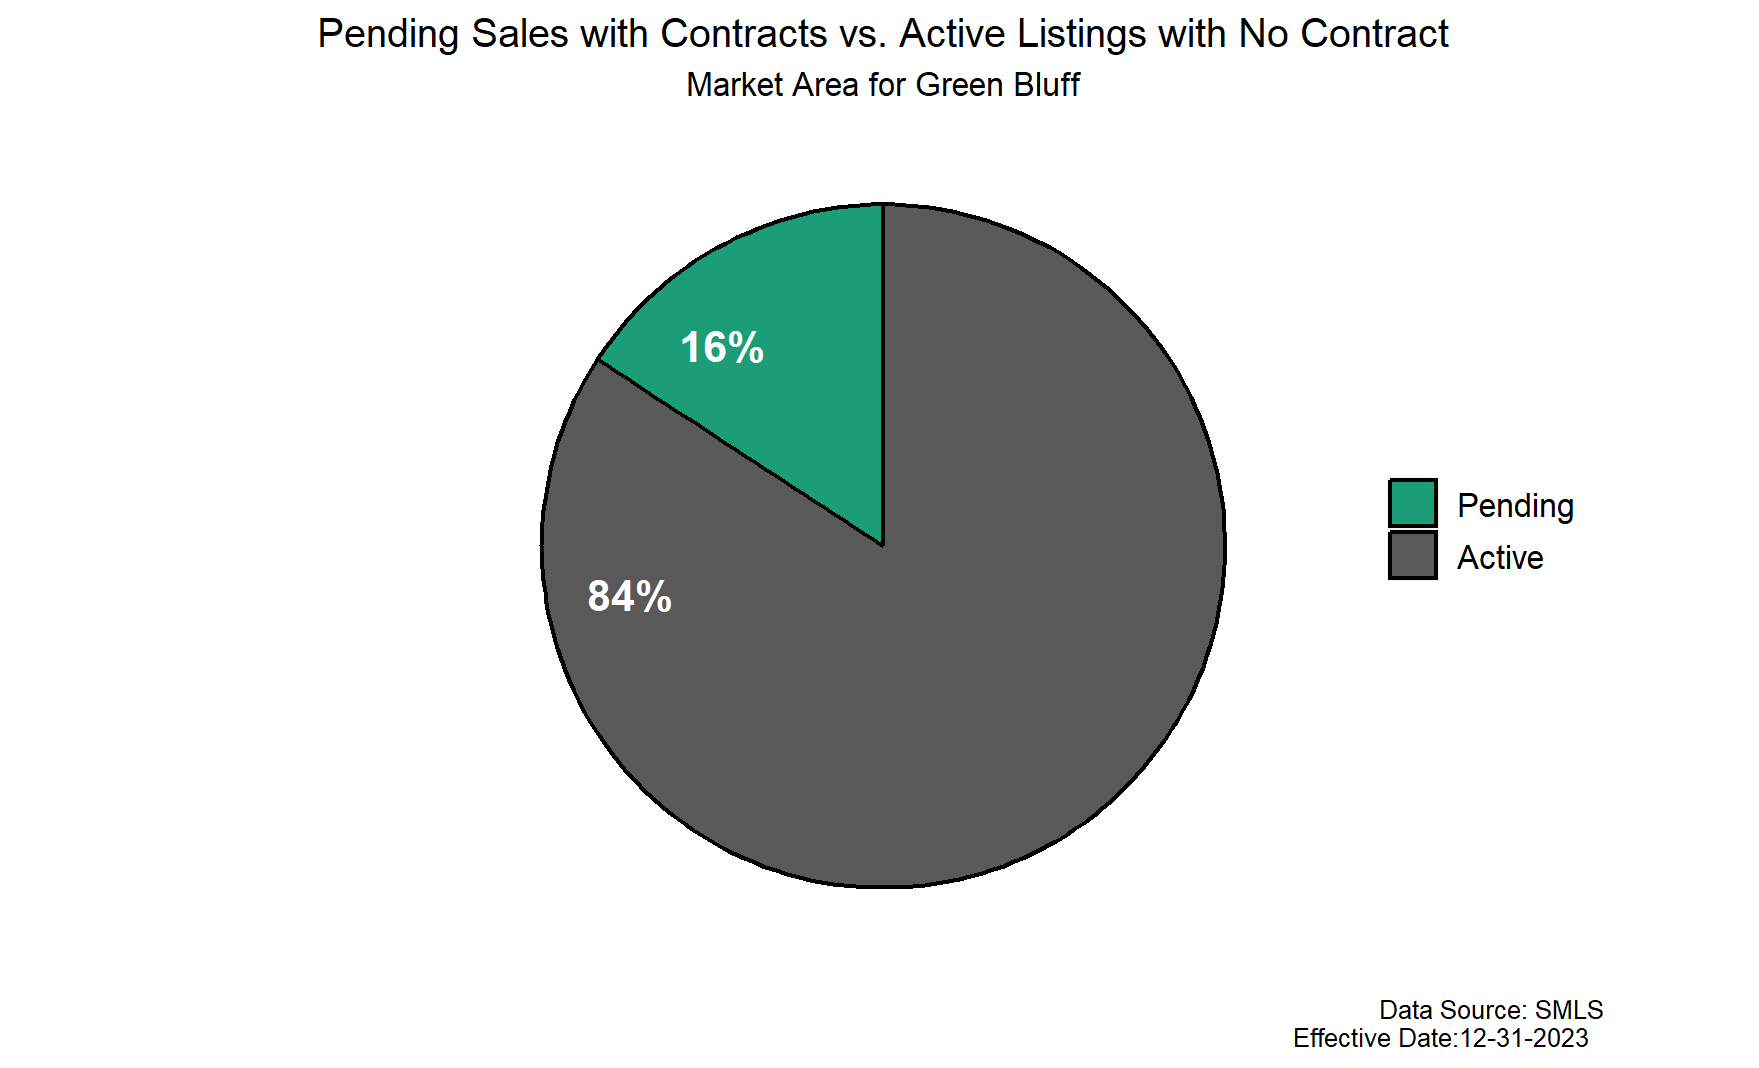
Currently in this market, there are more active listings that do not have a contract than pending listings with a contract. Typically, more active listings than pending indicates a buyer’s market. See the chart below with the pending to active percentages.
Property Values / Sale Prices
Annual Price Trends
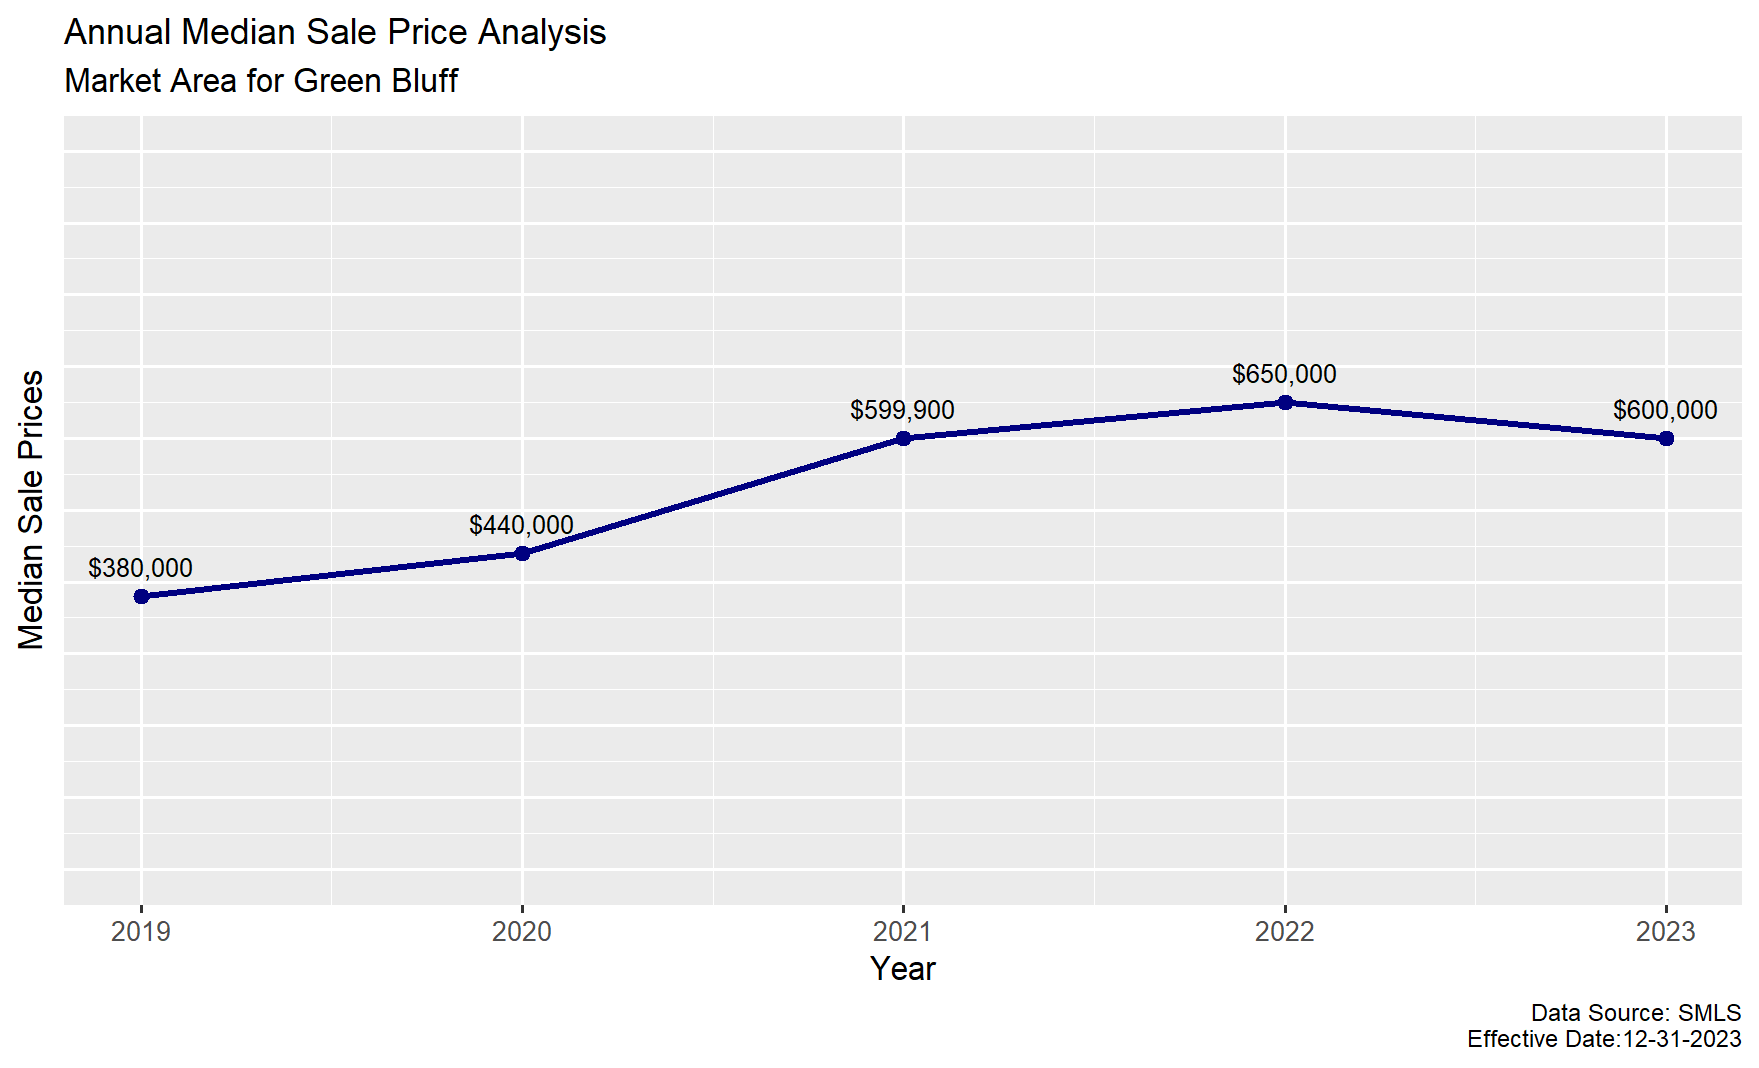
Prices in this market have increased over the last several years through 2022 but have declined since 2022 to 2023.
Sale Price Distribution (Resales & New Construction)
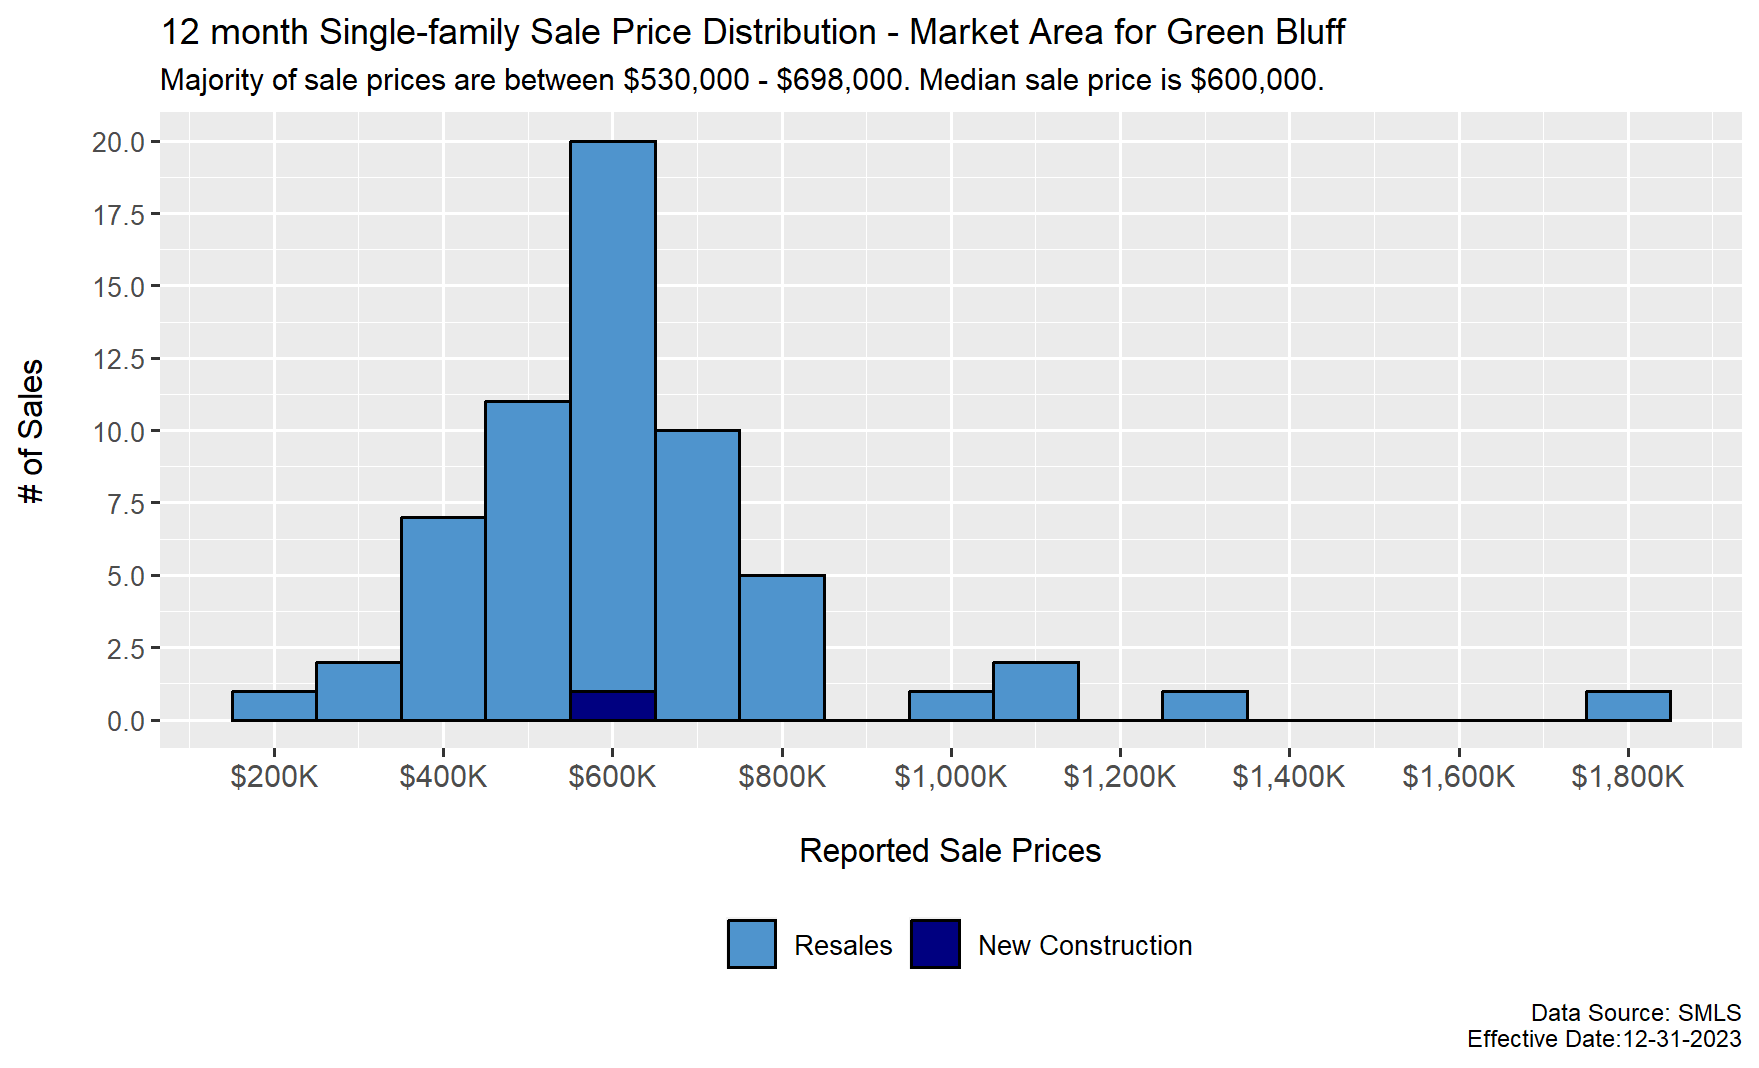
Sale prices ranged from $275,000 – $1,835,000; the median sale price was $600,000. The sale price distribution for all of the resale and new construction homes in this market area is in the next graph.
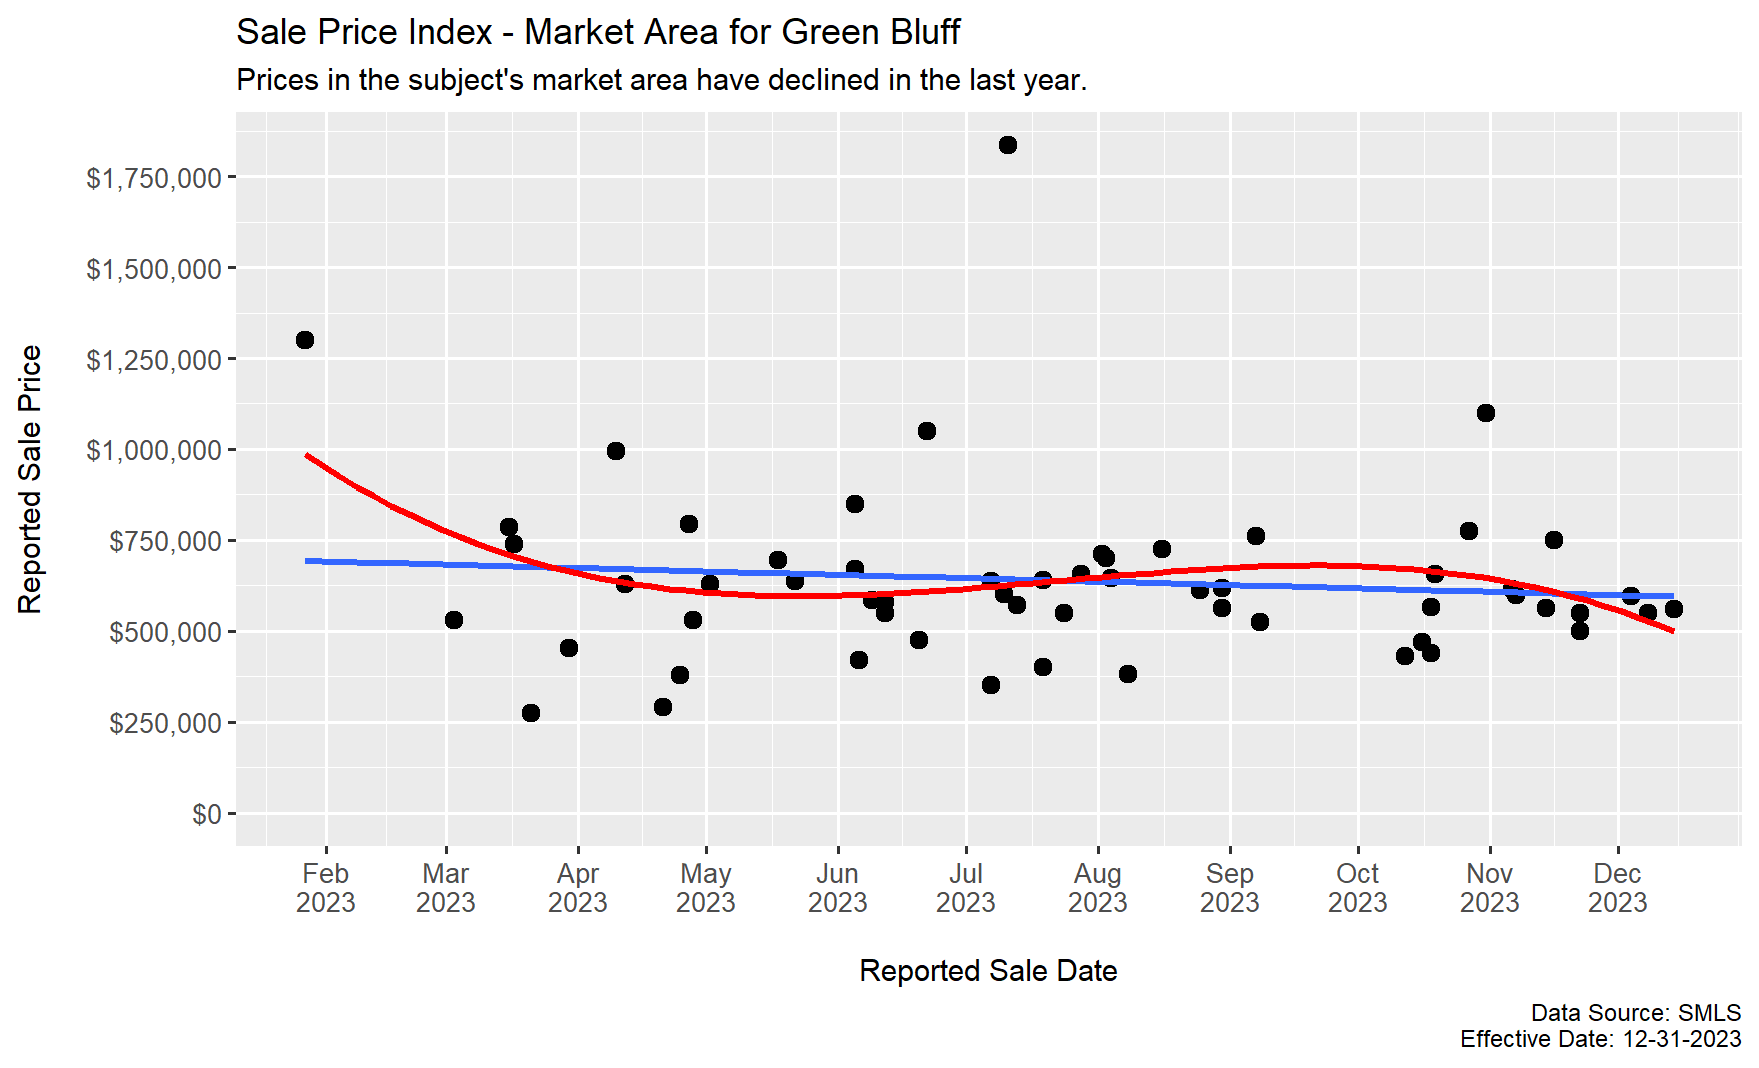
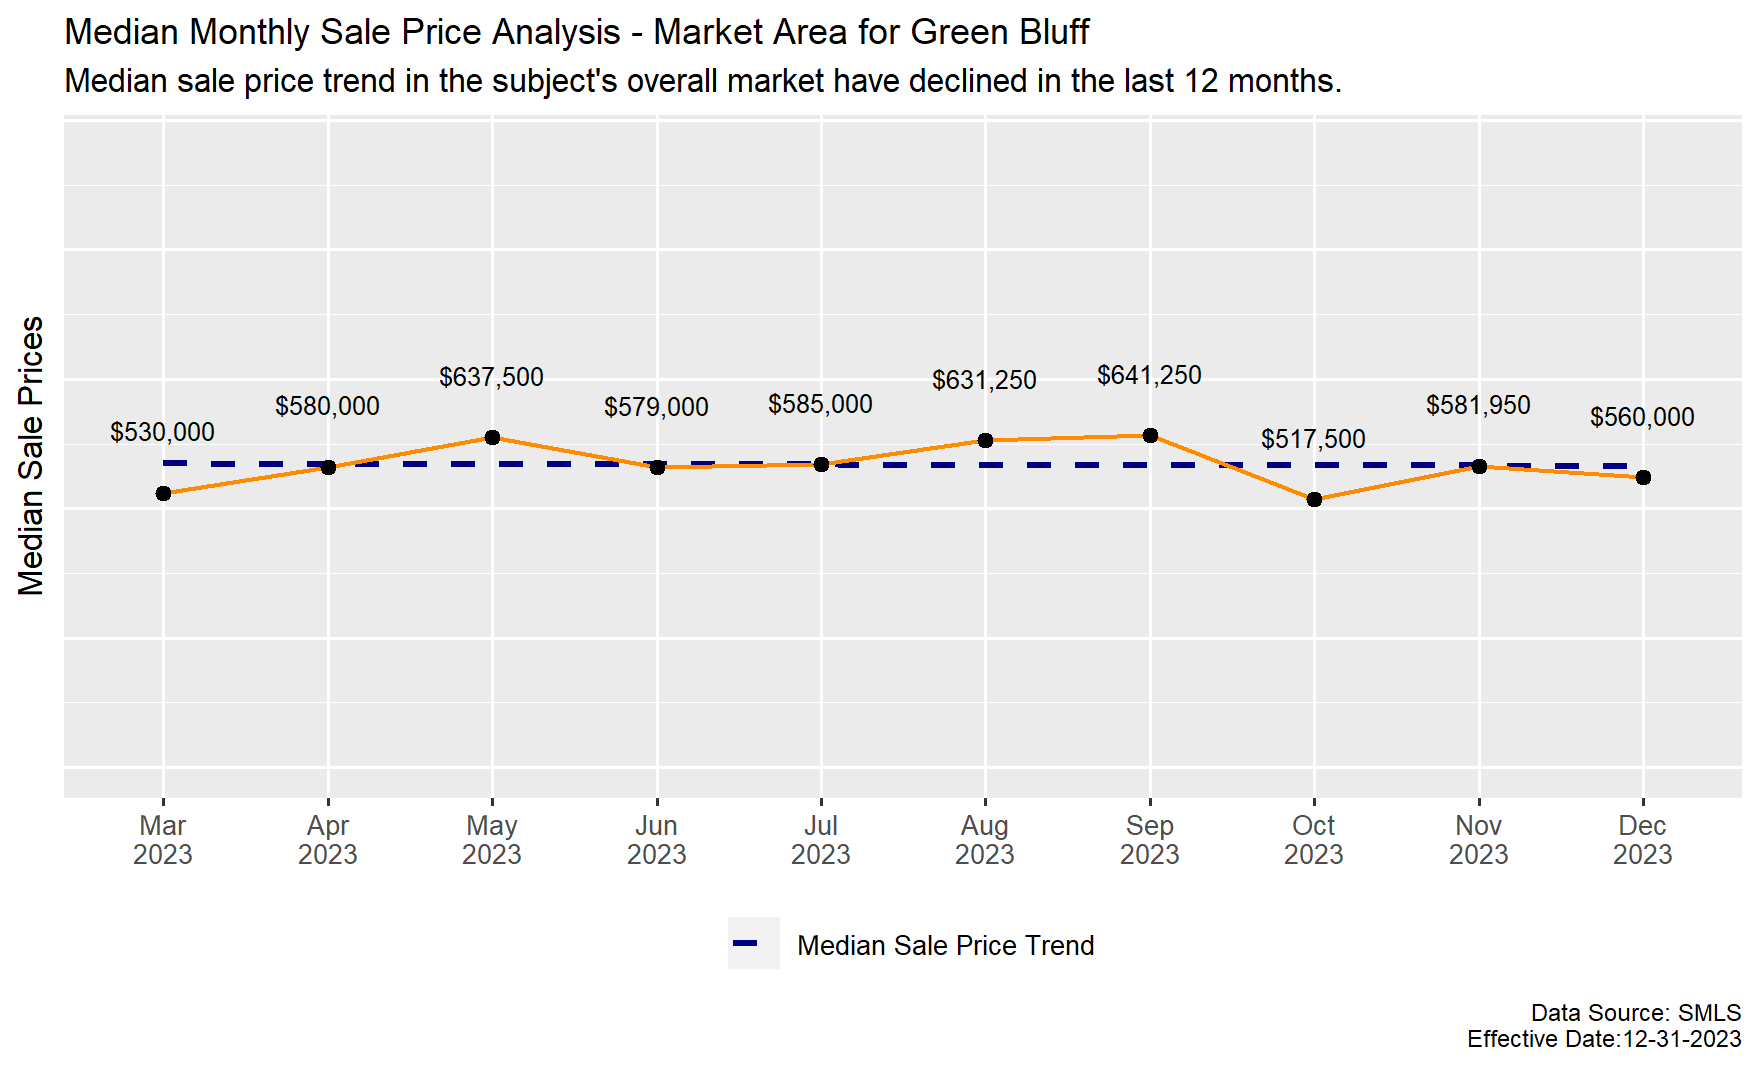
Prices in the subject’s OVERALL market area have declined slightly over the last year. See the following graphs showing the sale price index of individual sales and then the median sale price trend, both showing a decline in prices.
List to Sale Price (LPSP) Ratios
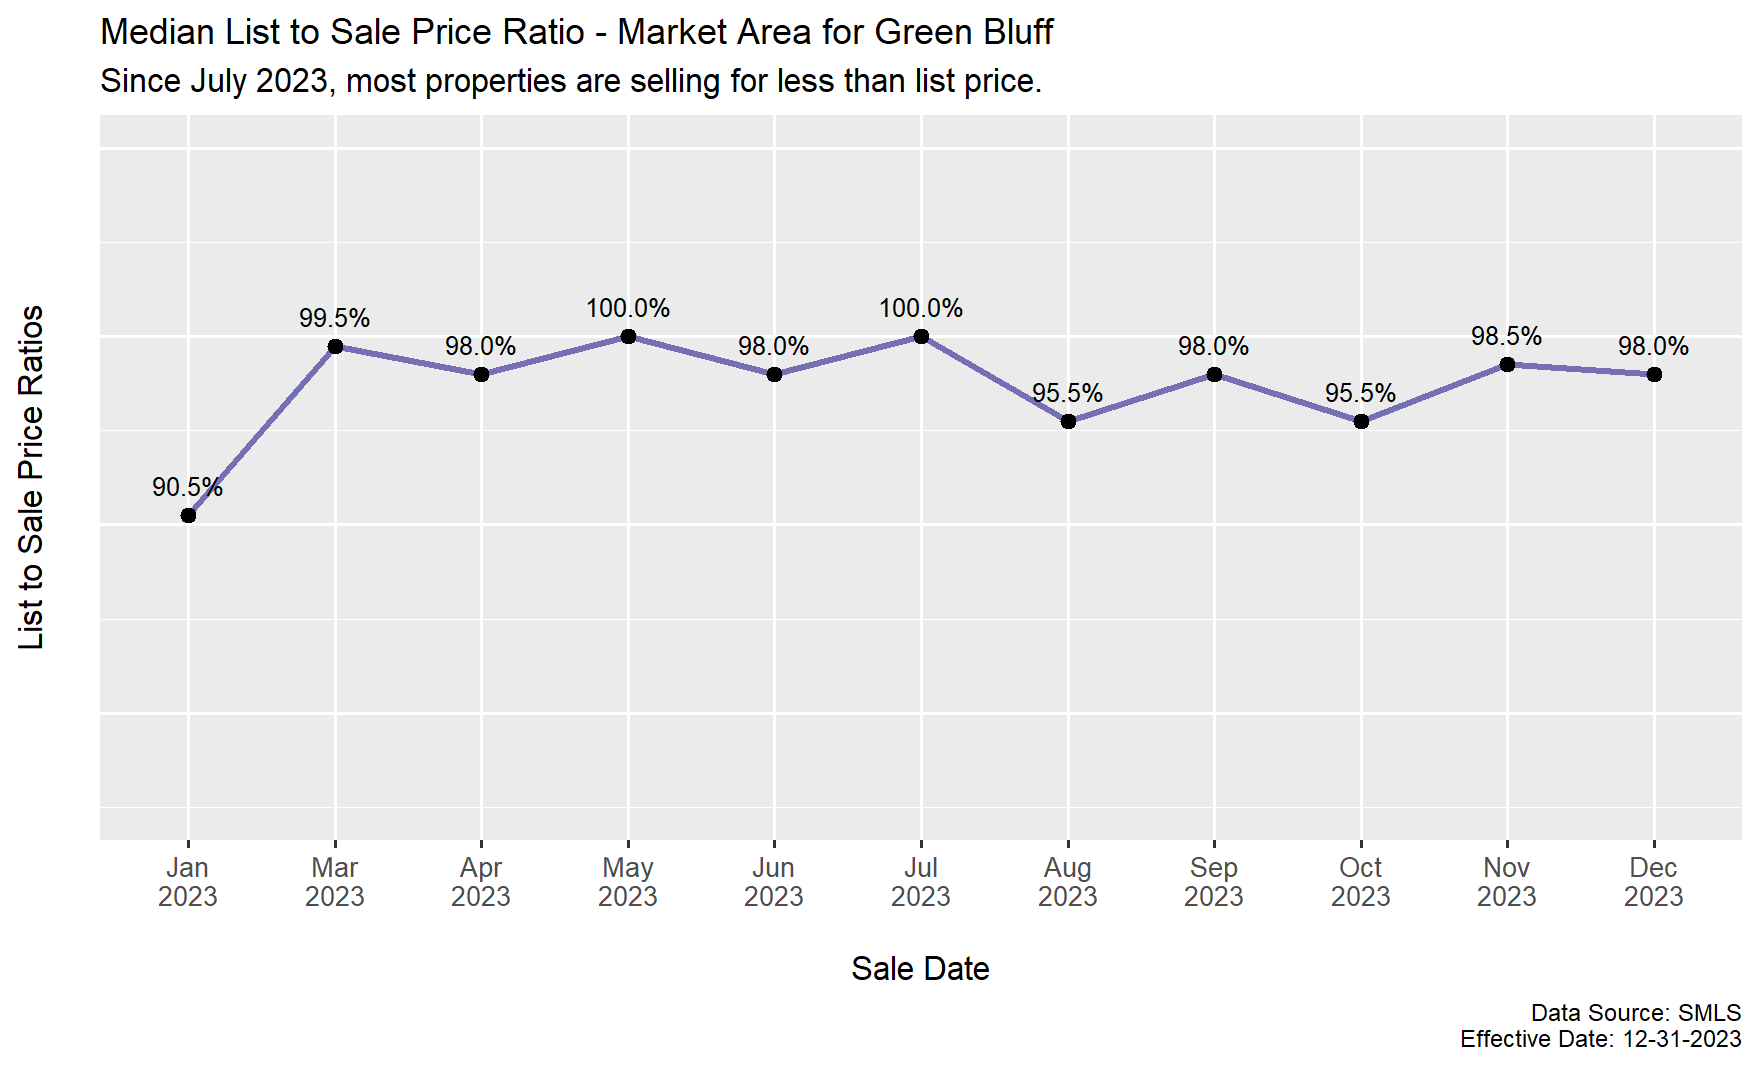
The median LPSP ratios have declined over the last year. Since July of 2023 until now, most properties have been selling for less than their list prices. See the LPSP ratio chart below that shows the trend.
List Price Ratios by Days on Market
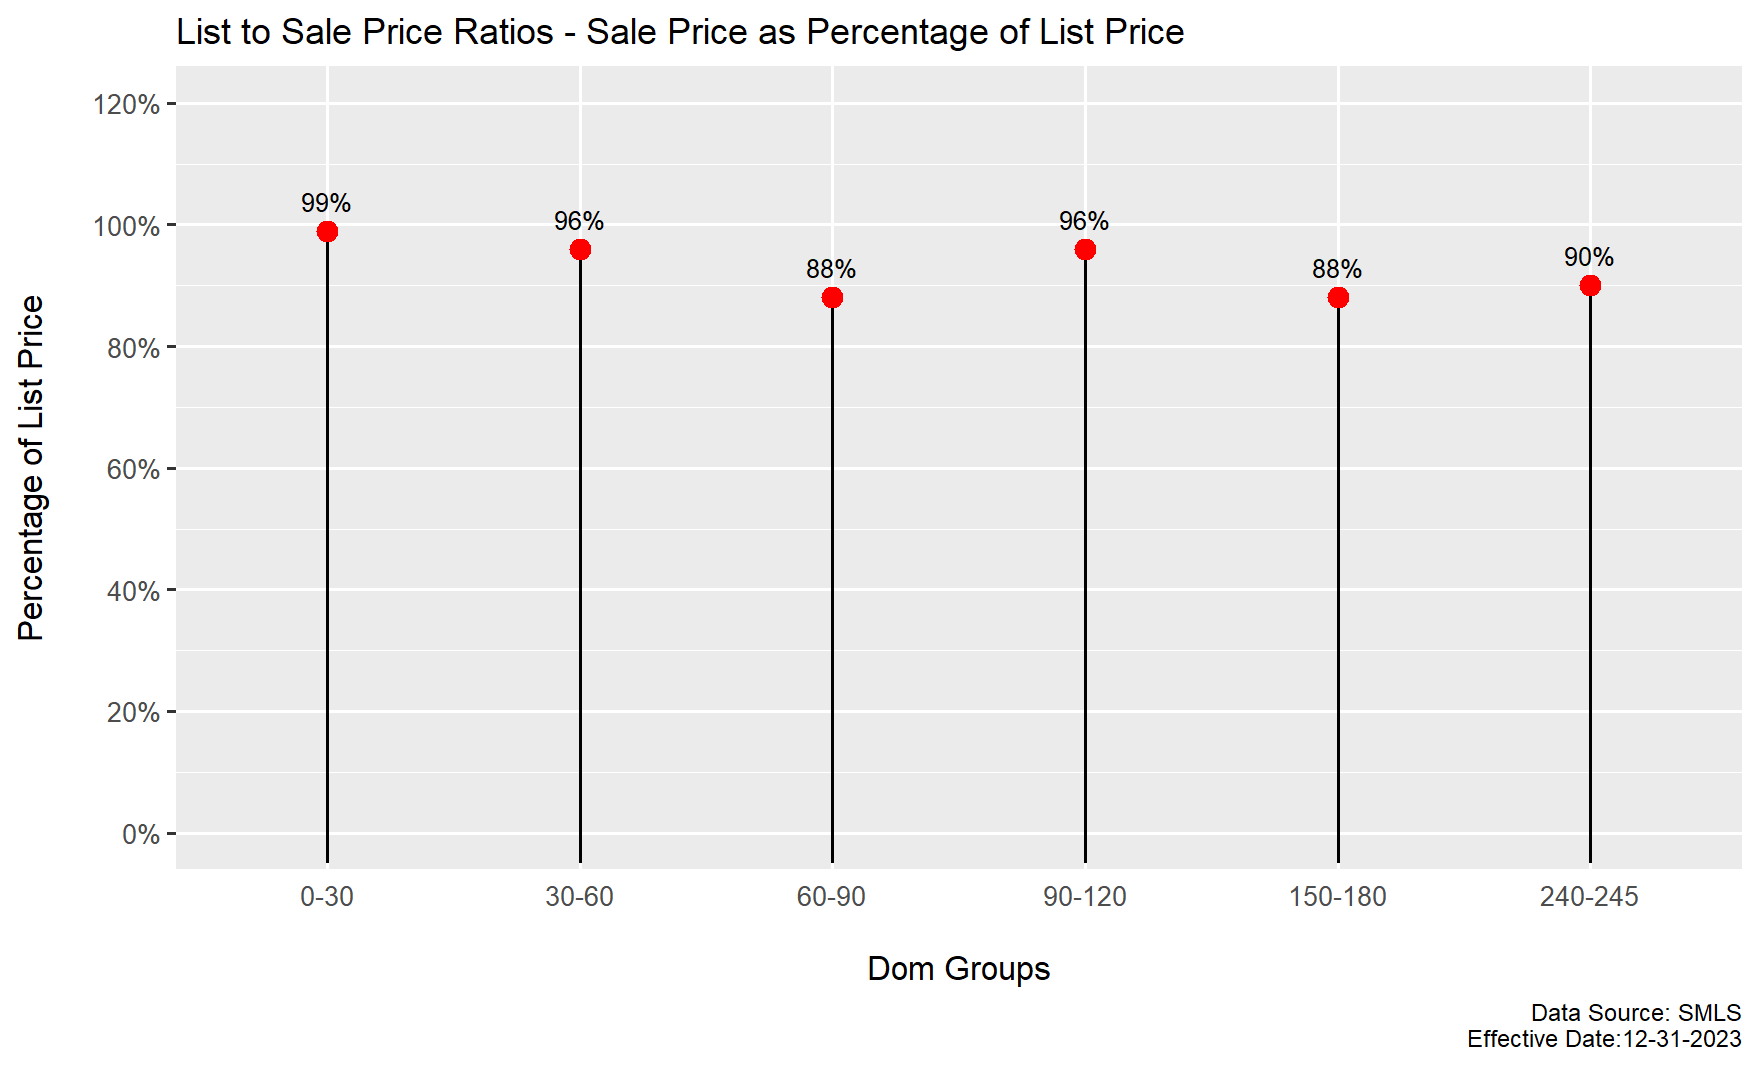
The longer a property is on the market, it will typically sell far below its original listing price. By the time is reaches its final list price after all price reductions, a property will often still sell even lower than its final list price the longer it’s on the market. This is usually due to either:
- Buyers making offers less than list price and sellers accepting that offer because their property has been on the market a while.
- A property may go under contract at the list price, but there may be inspection problems and the seller reduces the price as a result, or there may be an appraisal less than the contract price and the seller has to reduce the price.
The next chart shows sales in 30-day DOM (days on market) groups. The trend in list price ratios shows that the longer a property is on the market, it usually sells for less than its list price.
Demand/Supply
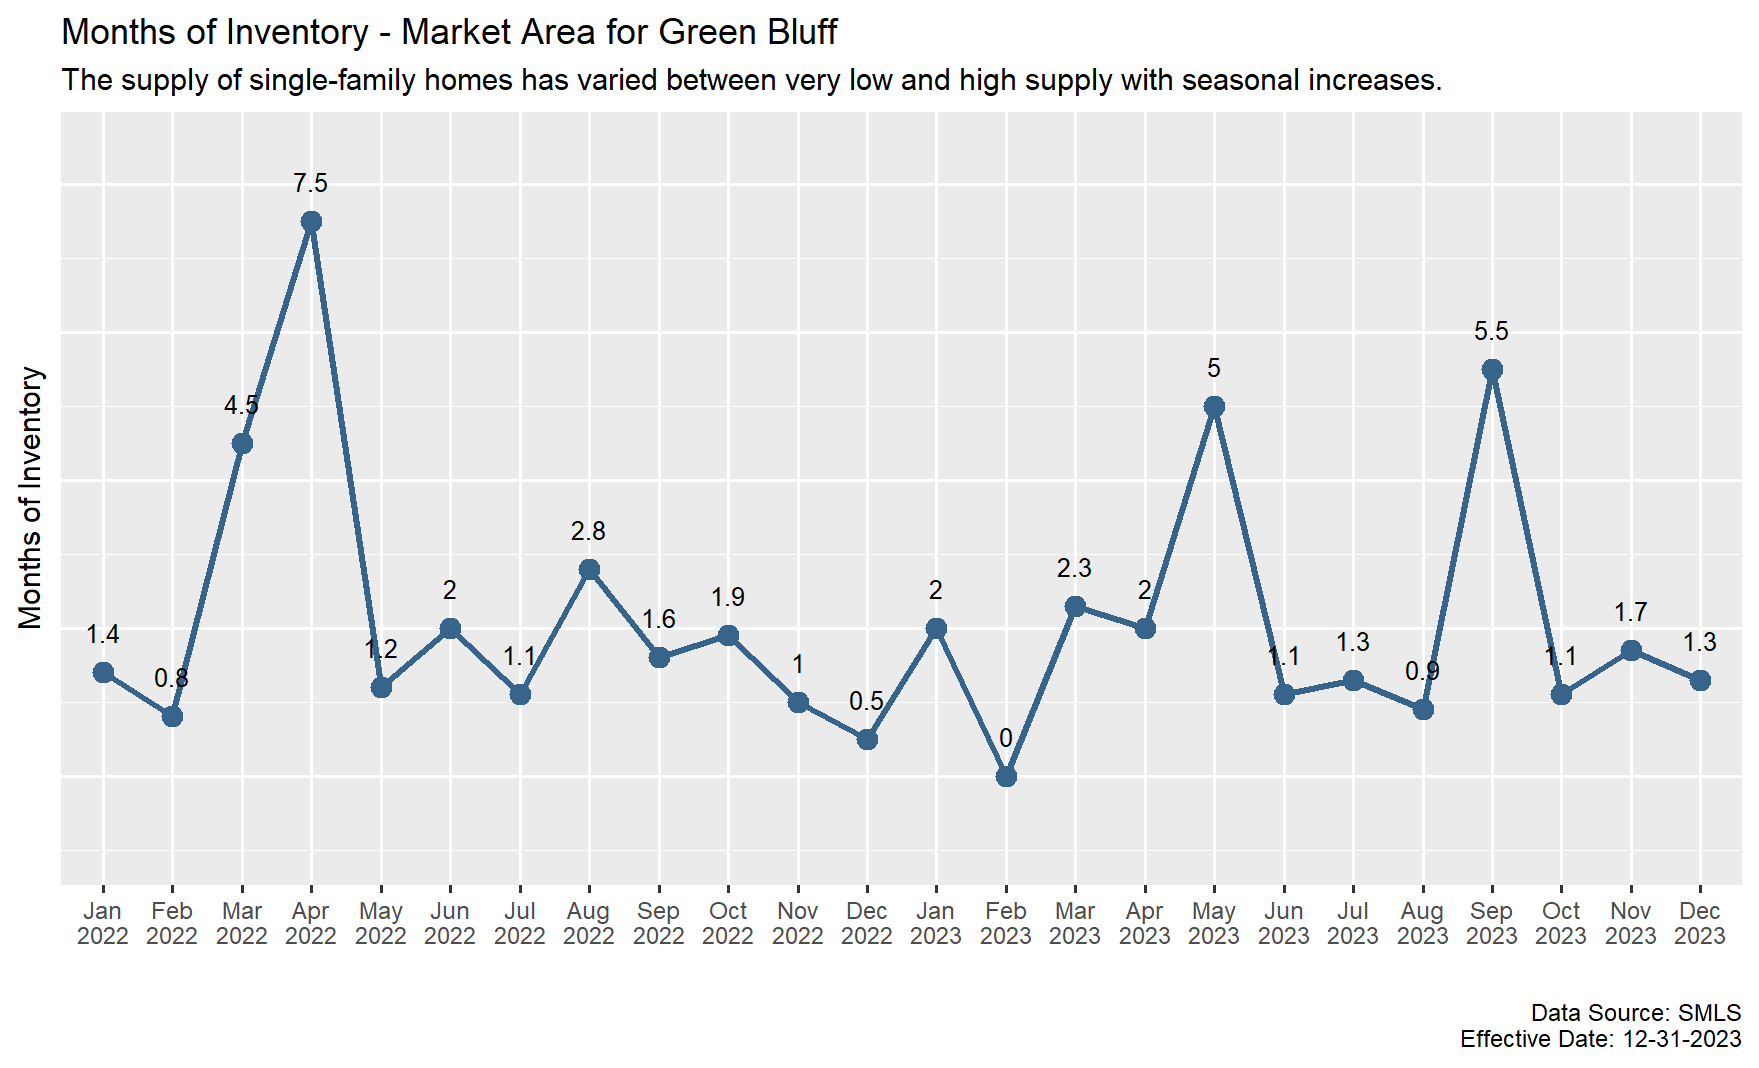
The total months inventory in this area has been fluctuated from low to high with a recent decrease. On the effective date, there was a 1.3 month supply of single-family listings, which is about a 40-day supply of homes for sale. This means that if no more houses were listed for sale, all of the homes on the market would sell in 40 days or less.
Typically, this market has a lower supply of houses for sale during the colder months and sees an increase in listing coming on the market in spring and summer. The trend for this 4th quarter of 2023 is starting to see its typical decrease in listings already, and it is anticipated that there will be more listings entering late winter and spring of 2024. See the following graph that shows the inventory trends.
Inventory by Price Range
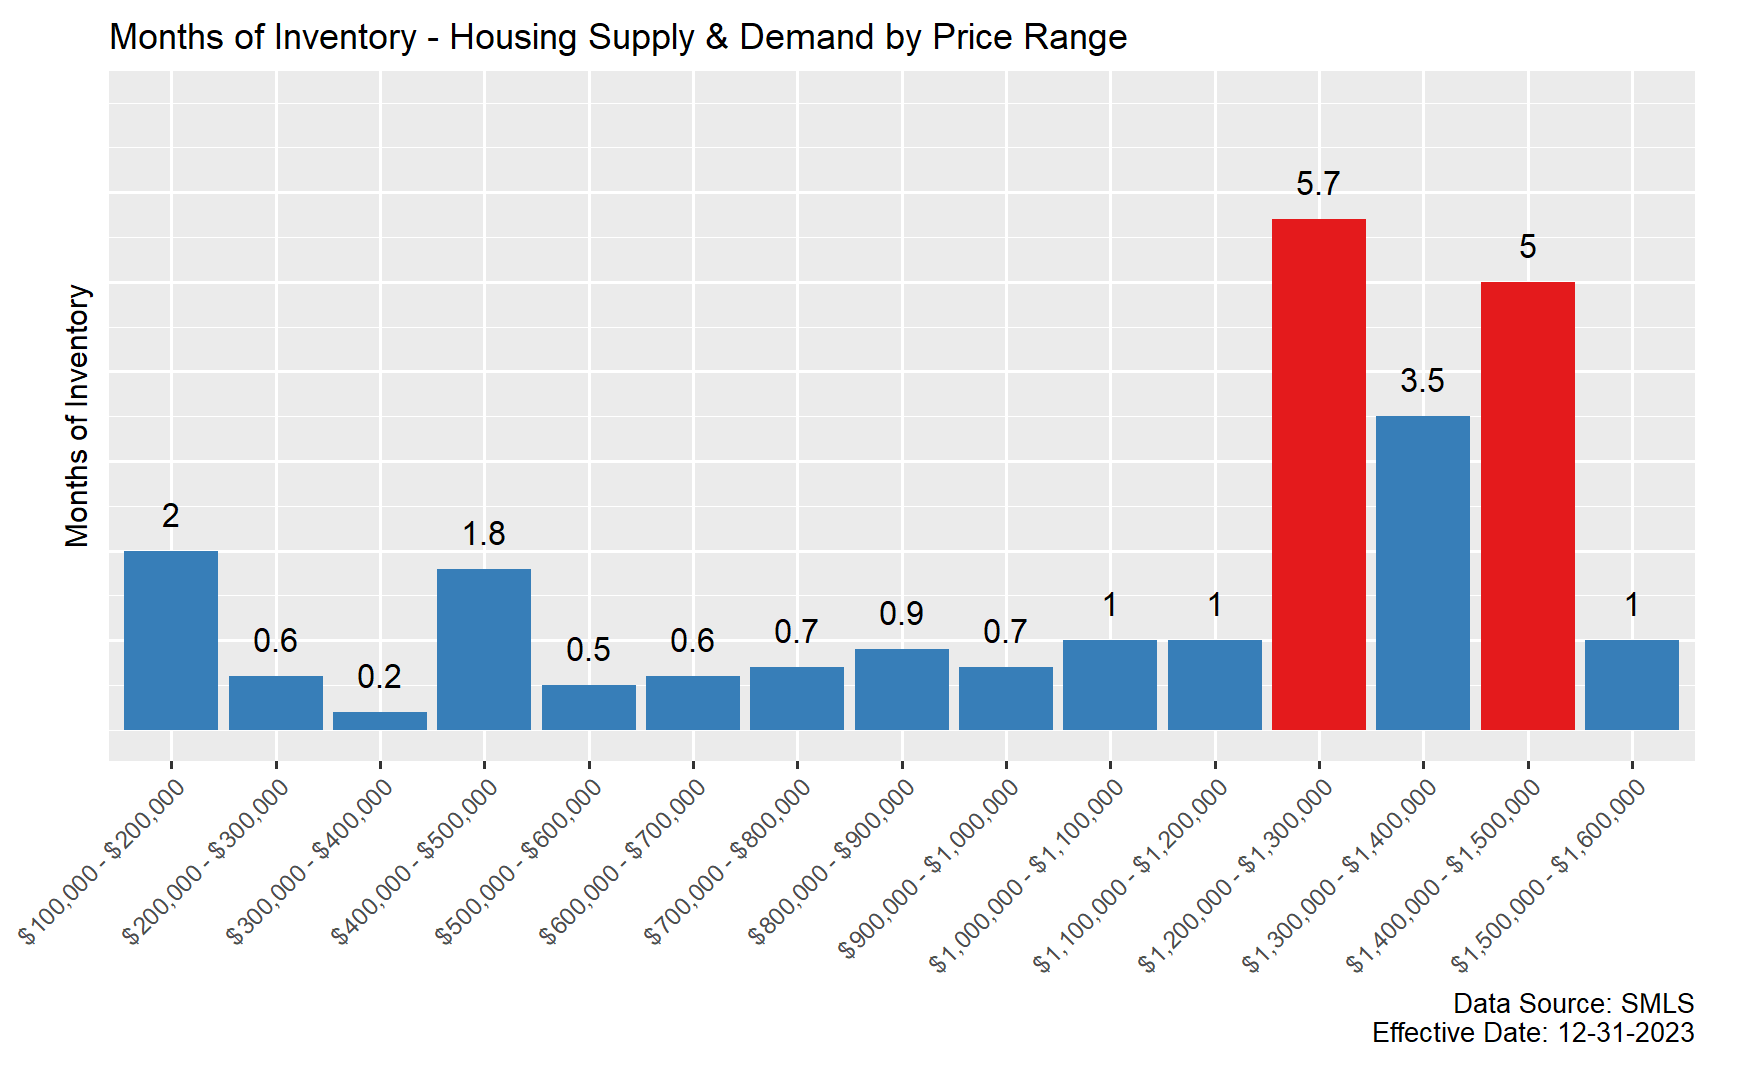
Various price ranges have different supplies of housing. In this market area, price ranges under $1,200,000 have much lower supplies of houses for sale, which helps create more competition among more affordable properties.
Above $1,200,000, there are much higher supplies of listings for sale. A couple price brackets almost have an oversupply, which allows buyers to be very picky and often results in these higher priced properties taking much longer to get an offer. See the following graph that shows the inventories by price ranges.
Marketing Times
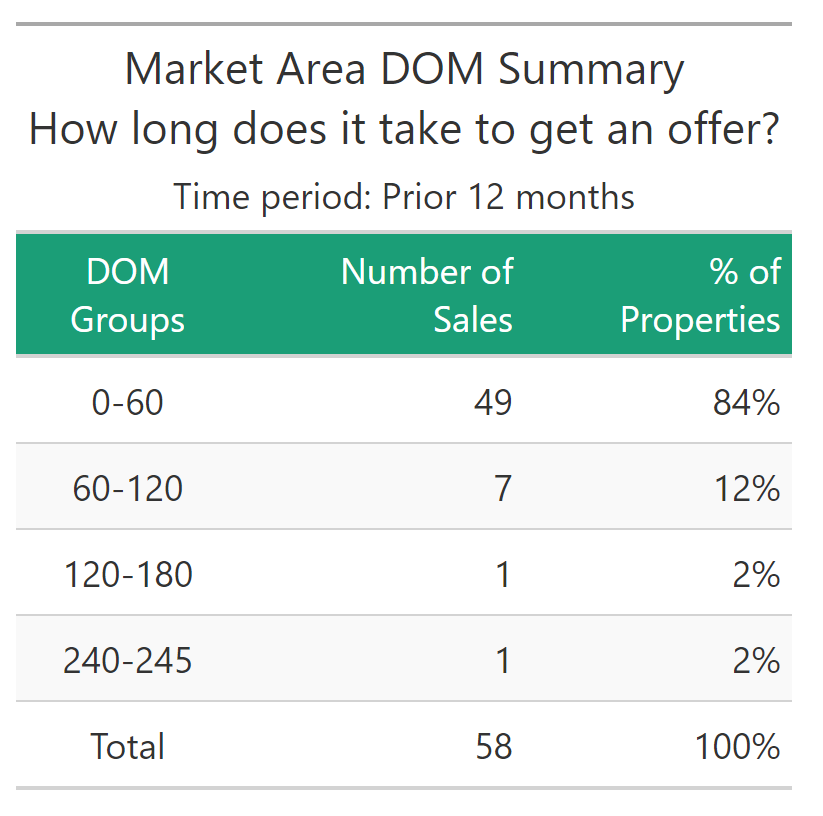
Marketing Times Table
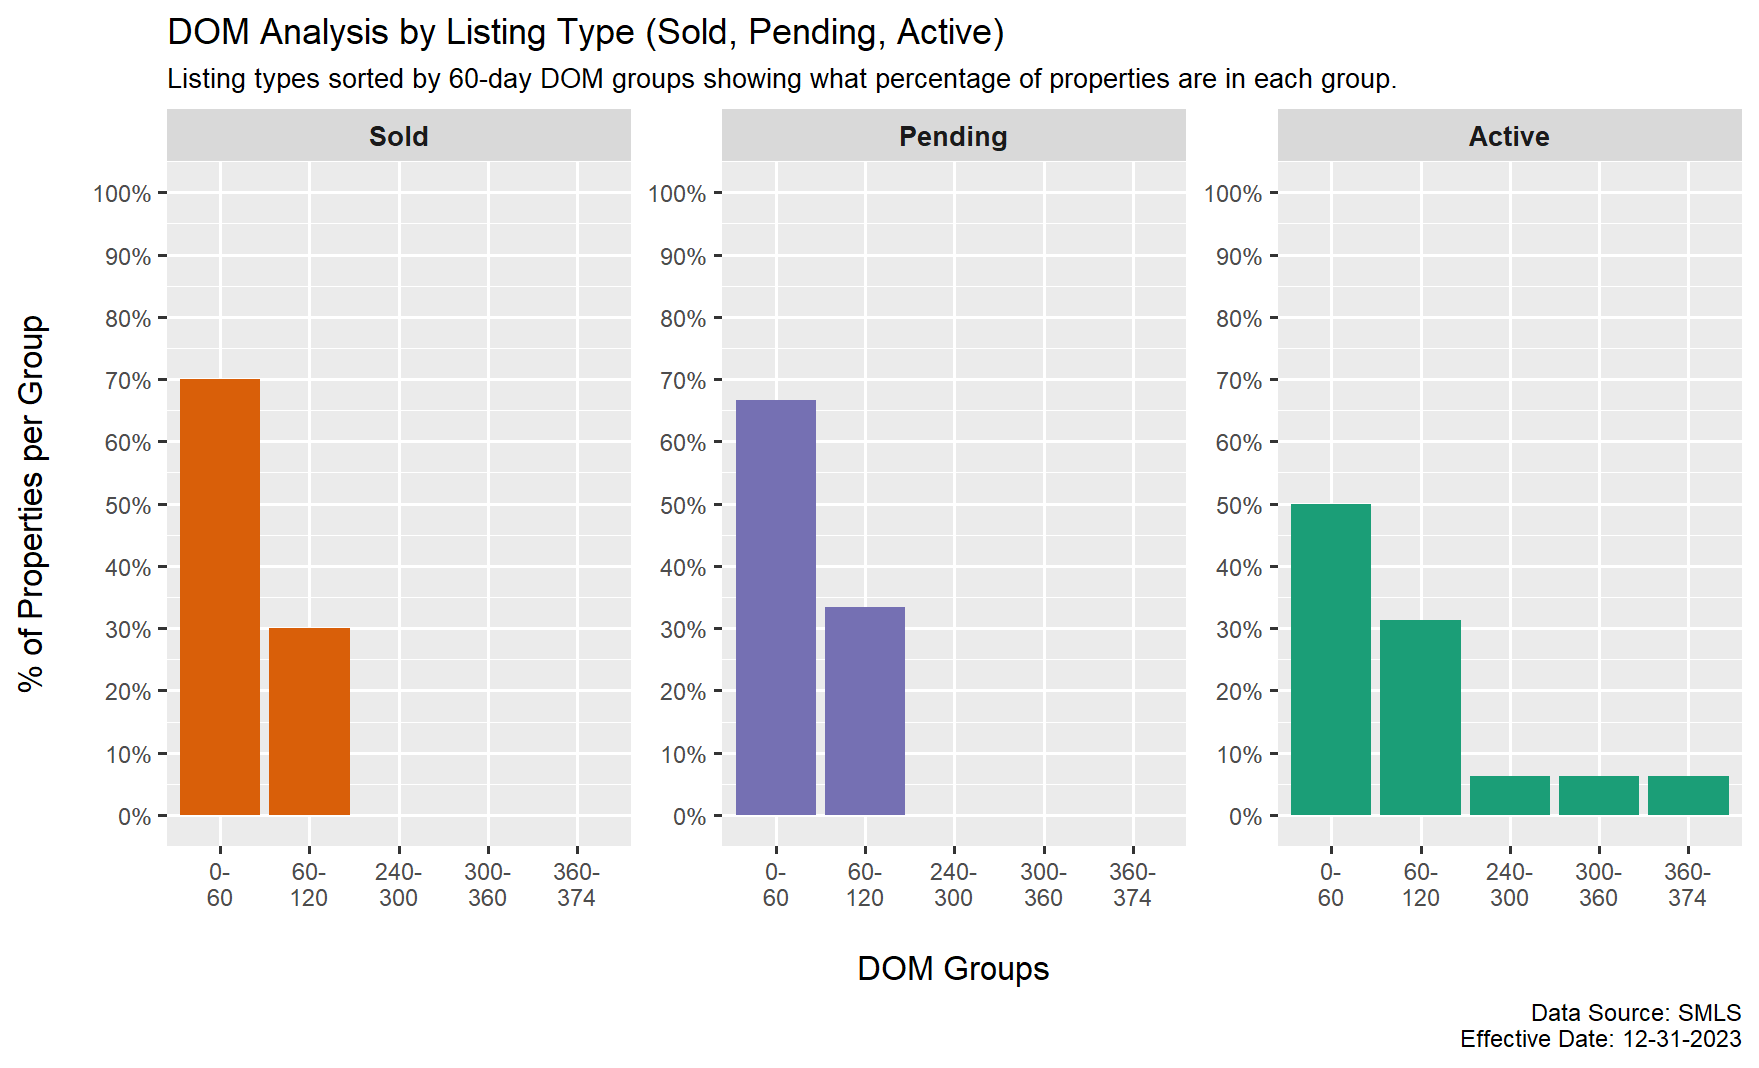
Most properties are recently getting an offer within 60 days on market. If a listing is on the market longer than 120 days, it is probably overpriced.
Estimated Marketing Time
Based on the previous analysis of marketing times, it could take up to 120 days of marketing or more to get an offer on a property listed for sale in the Green Bluff market area.
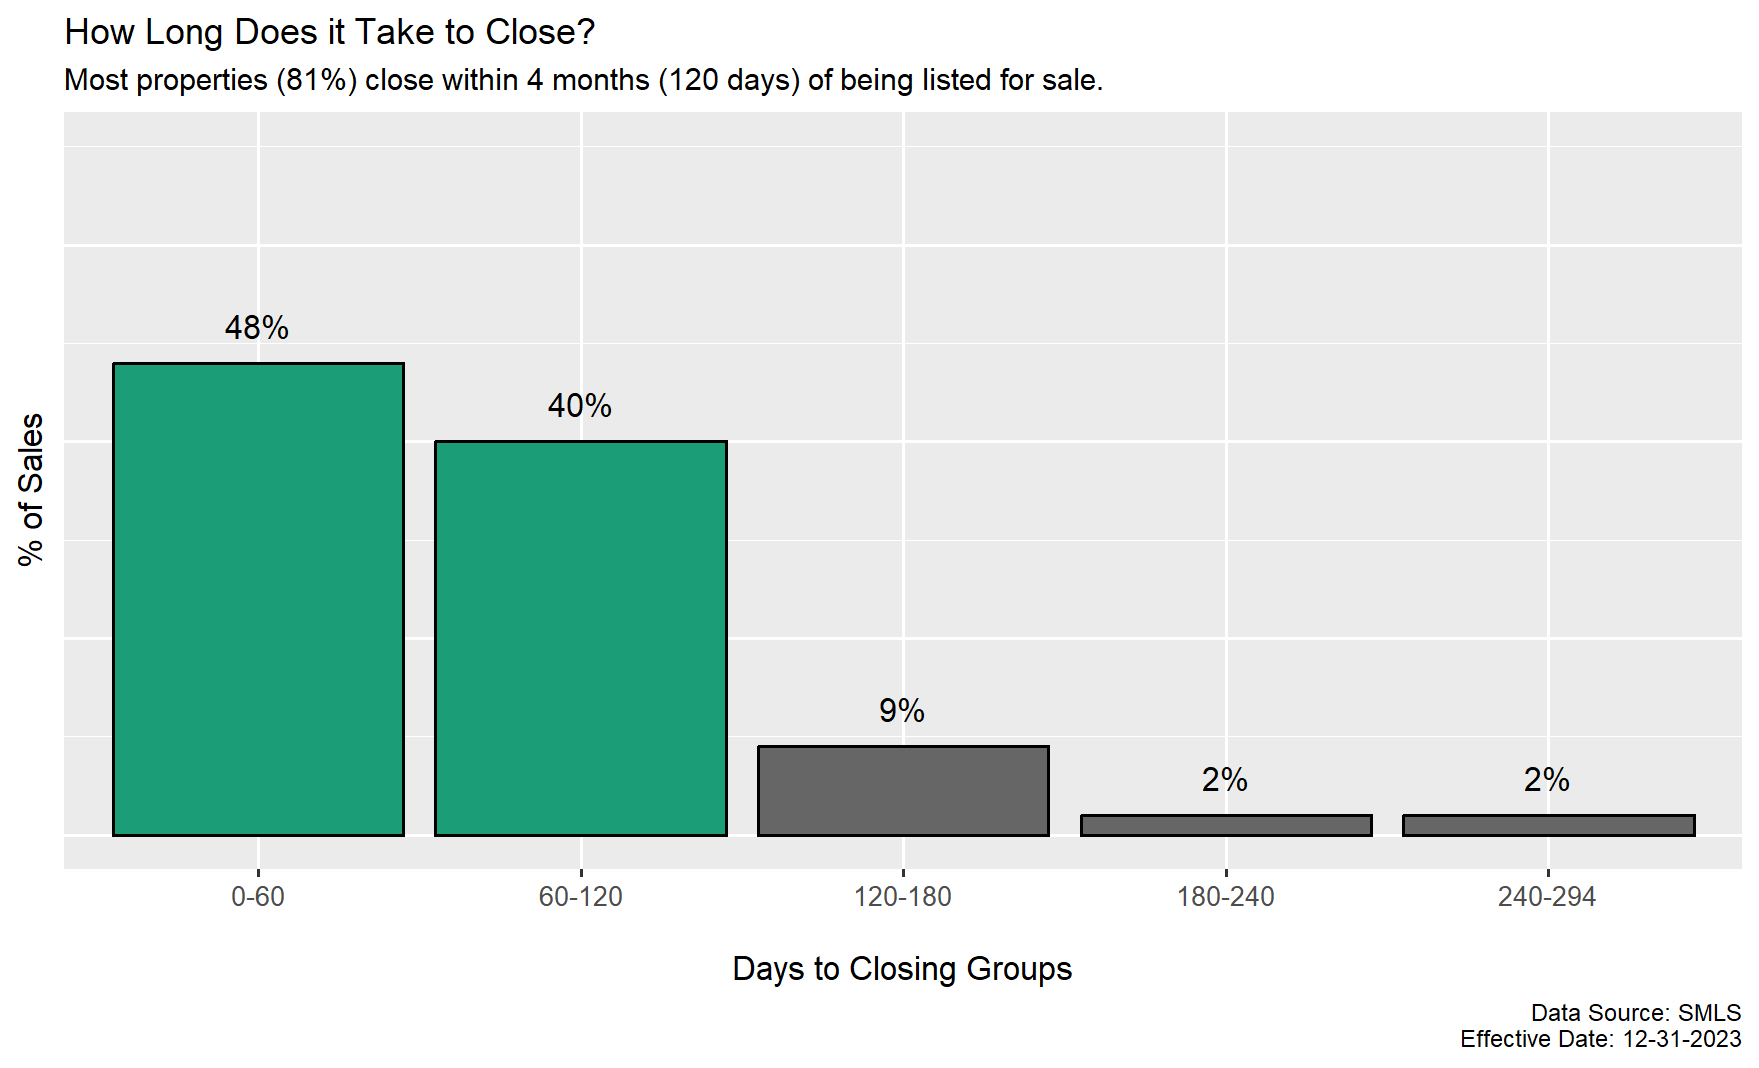
Time to Closing
From the day a property is listed for sale, the time it takes to get to closing can take up to 6 months in this current market. Most properties are closing in 4 months or less, but with marketing times taking longer, this is extending the time it can take to get to the closing table when you can expect to get the proceeds from the sale of your property.
How Buyers are Paying for Property
Effect of Increasing Loan Rates
Property prices are heavily influenced by current loan rates. When loan interest rates are high, it makes property less affordable for buyers. When buyers can’t afford property, this results in some getting out of the real estate market. Eventually, there is less demand for the properties that are listed for sale. If buyers aren’t competing with each other driving the prices up, eventually the market dynamic shifts to sellers competing with each other to sell their property, which results in pushing the prices DOWN.
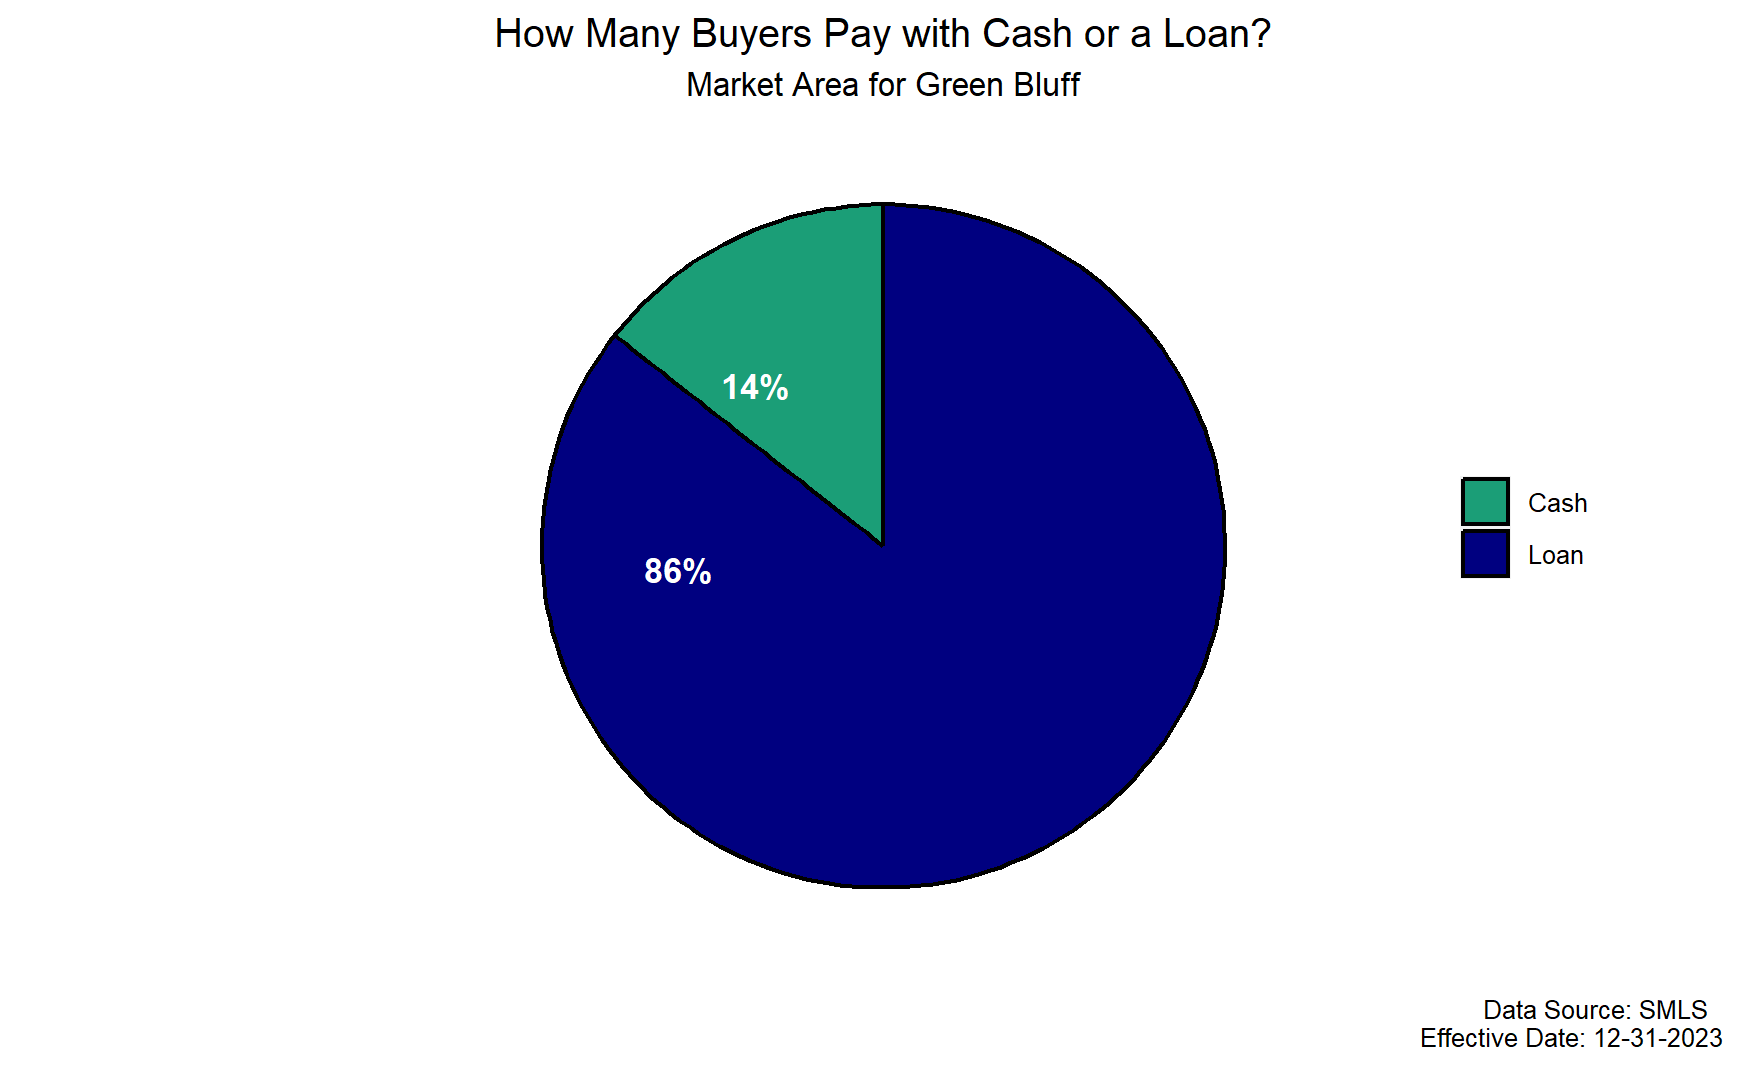
Payment Type – Cash vs. Loan
Most buyers purchase property with a loan in this market. Because most loans require an appraisal, if a listing is overpriced, and the appraised opinion of value is less than the contract price in the offer, the chances of the property selling at the high contract price are low, in fact, a 14% chance or less, which is the percentage of cash buyers in the subject property’s market.
Loan Price Limits
Some loans have more strict lending requirements than others. Also, some loans have price limits, like FHA. For 2023, the current FHA loan limit for a single-family dwelling in Spokane County is $498,2571. If the price of property is over this FHA limit, then a single-family dwelling will not qualify for FHA financing since the property value would be higher than what FHA allows for a loan amount.
Loan Safety Requirements
Some loans have very specific safety requirements, like FHA or VA. When a buyer uses these types of loans, the appraiser checks the property for compliance with what’s generally called, “Minimum Property Requirements,” or MPRs for short. Features like the roof, water system, electrical system, exterior paint, etc. all have to meet rigorous safety requirements.
If a property doesn’t pass these safety requirements, either the seller or the buyer will have to make repairs or alterations to fix it so it passes. Otherwise, the lender won’t loan on the property.
Also, if the seller refuses to fix these items, and the buyer is unwilling or unable to fix them, then the lender will not loan on the property and the sale will not be able to close.
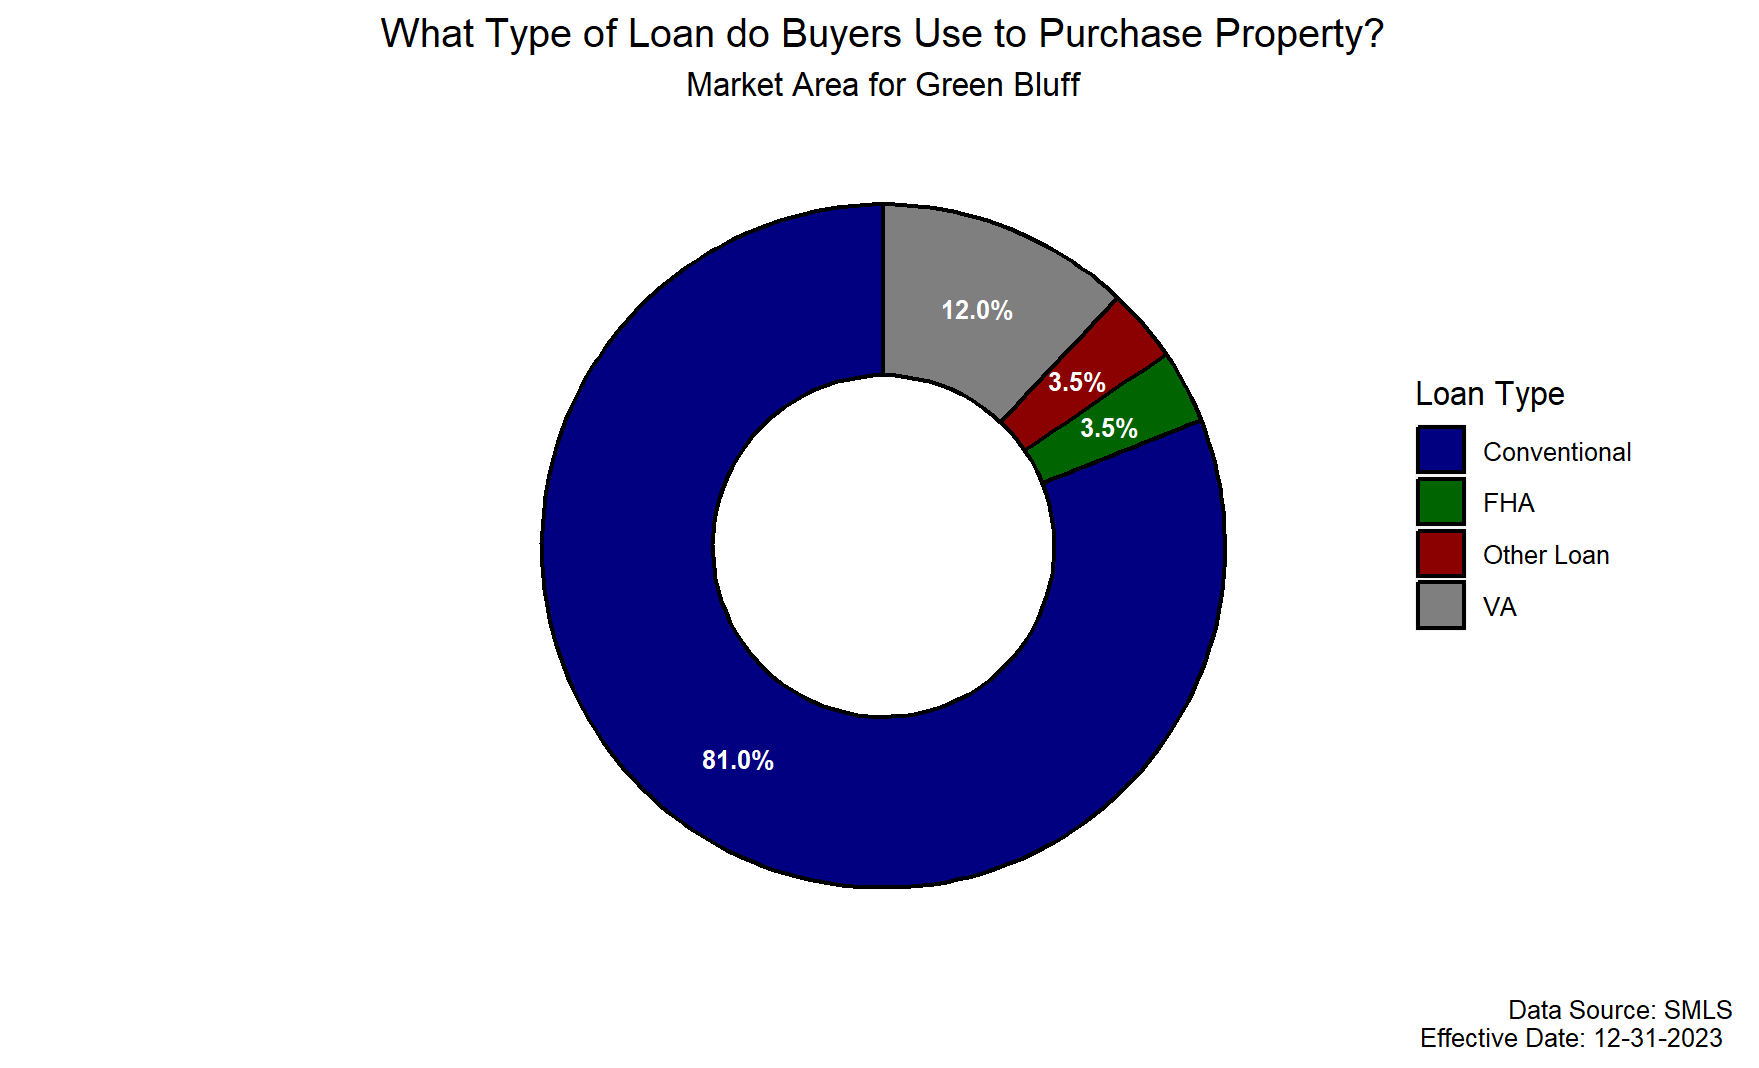
The following chart shows the most common loan types in this market:
Market Conditions Concluding Remarks
Overall, in this market area prices through 2022 and 2023 have declined. This is mostly due rising loan interest rates.
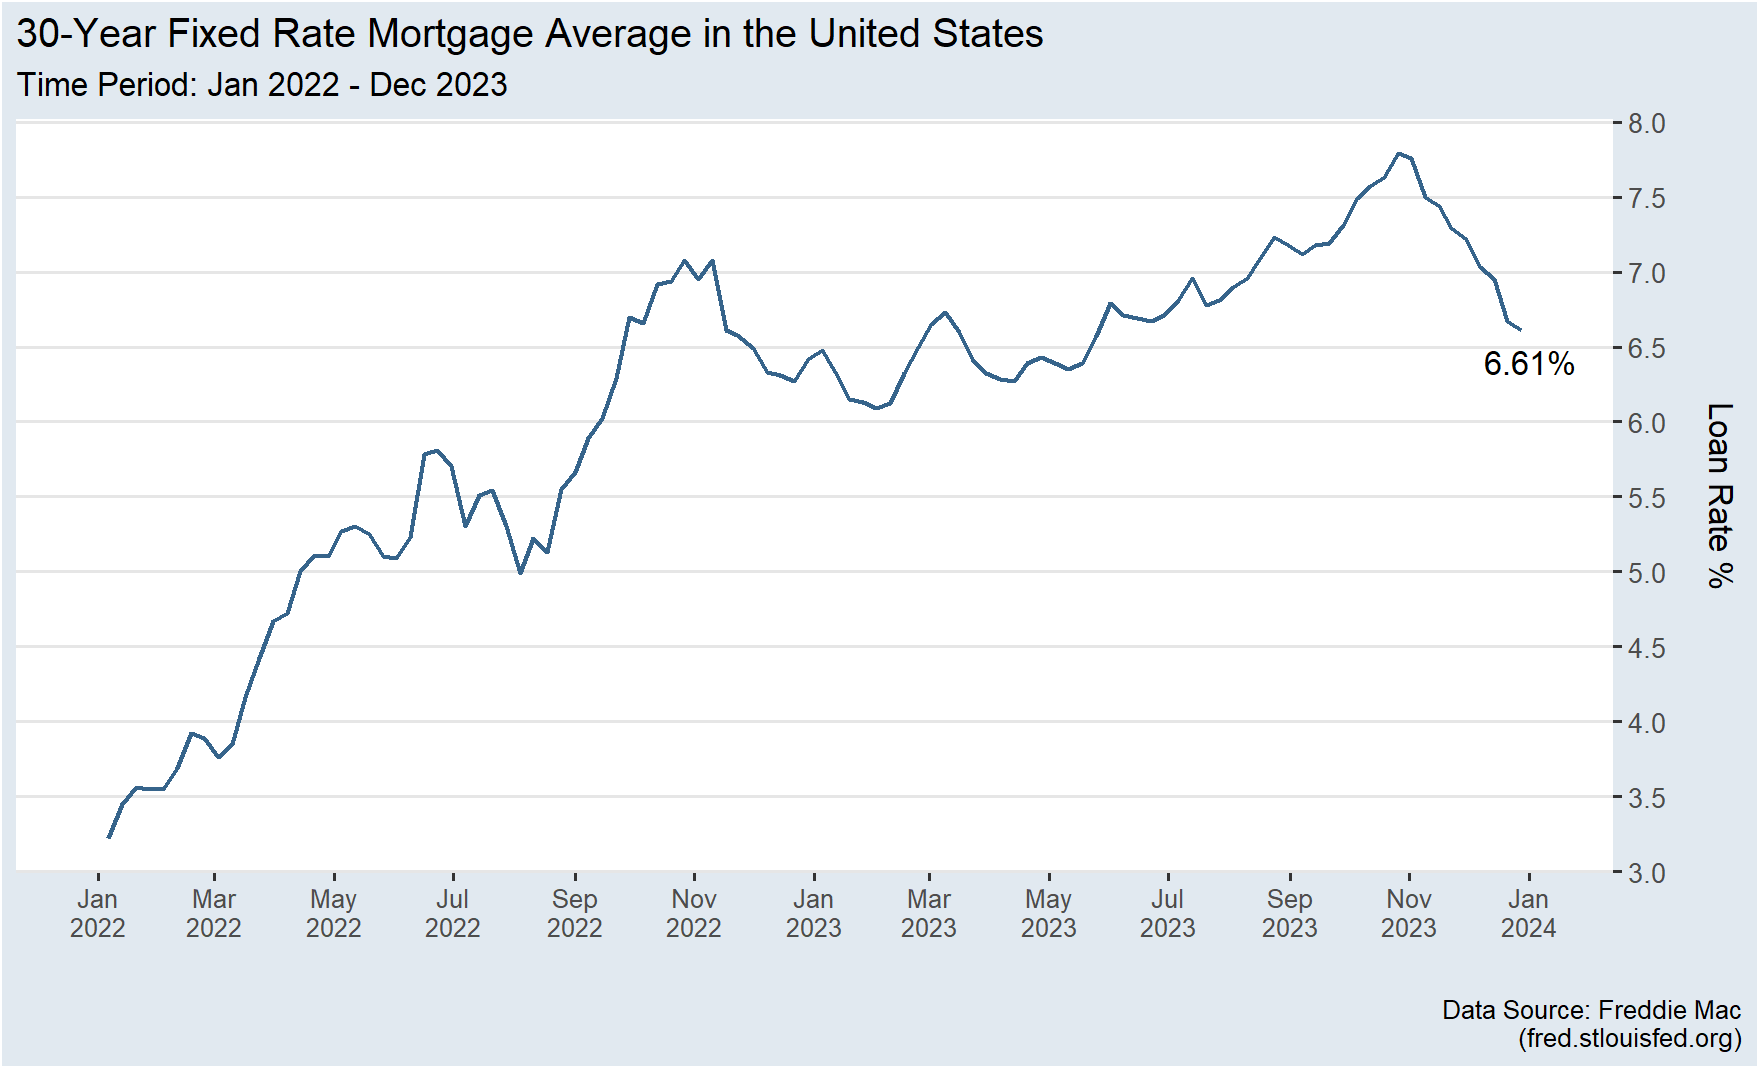
Increased loan rates have made property less affordable for buyers. According to loan trends from Freddie Mac2, loan rates peaked about November 2023 at almost 8%. This is almost a 5% interest rate increase from the beginning of 2022. This has been a major contributor to declining sale prices and increasing marketing times.
The higher loan rates result in many buyers being priced out of the market, thus reducing the demand for housing. As a result, with less demand, there is less upward pressure on prices due to a lack of or reduced competition for homes. Recently, loan rates have fluctuated and are at 6.61%. It is anticipated that loan rates should stay between the 6% – 7% range in 2024. The following graph from Freddie Mac shows the trend in loan rates since January 2022.
Marketing times have increased in recent months meaning it’s taking up to 120 days, or 4 months, to get an offer. Also, inventory is increasing, which means that there are more houses on the market giving buyers more choices and reducing competition among buyers. When more sellers list their properties, this now creates competition among sellers. When buyers compete, they tend to raise their offering price; however, when sellers compete to get a buyer to purchase their property, sellers tend to reduce the price and/or offer buyers concessions.
These trends indicate that this overall market and the subject’s market segment have slowed down, which results in properties taking longer to sell and prices declining.
HOUSING CHARACTERISTICS SUMMARIES
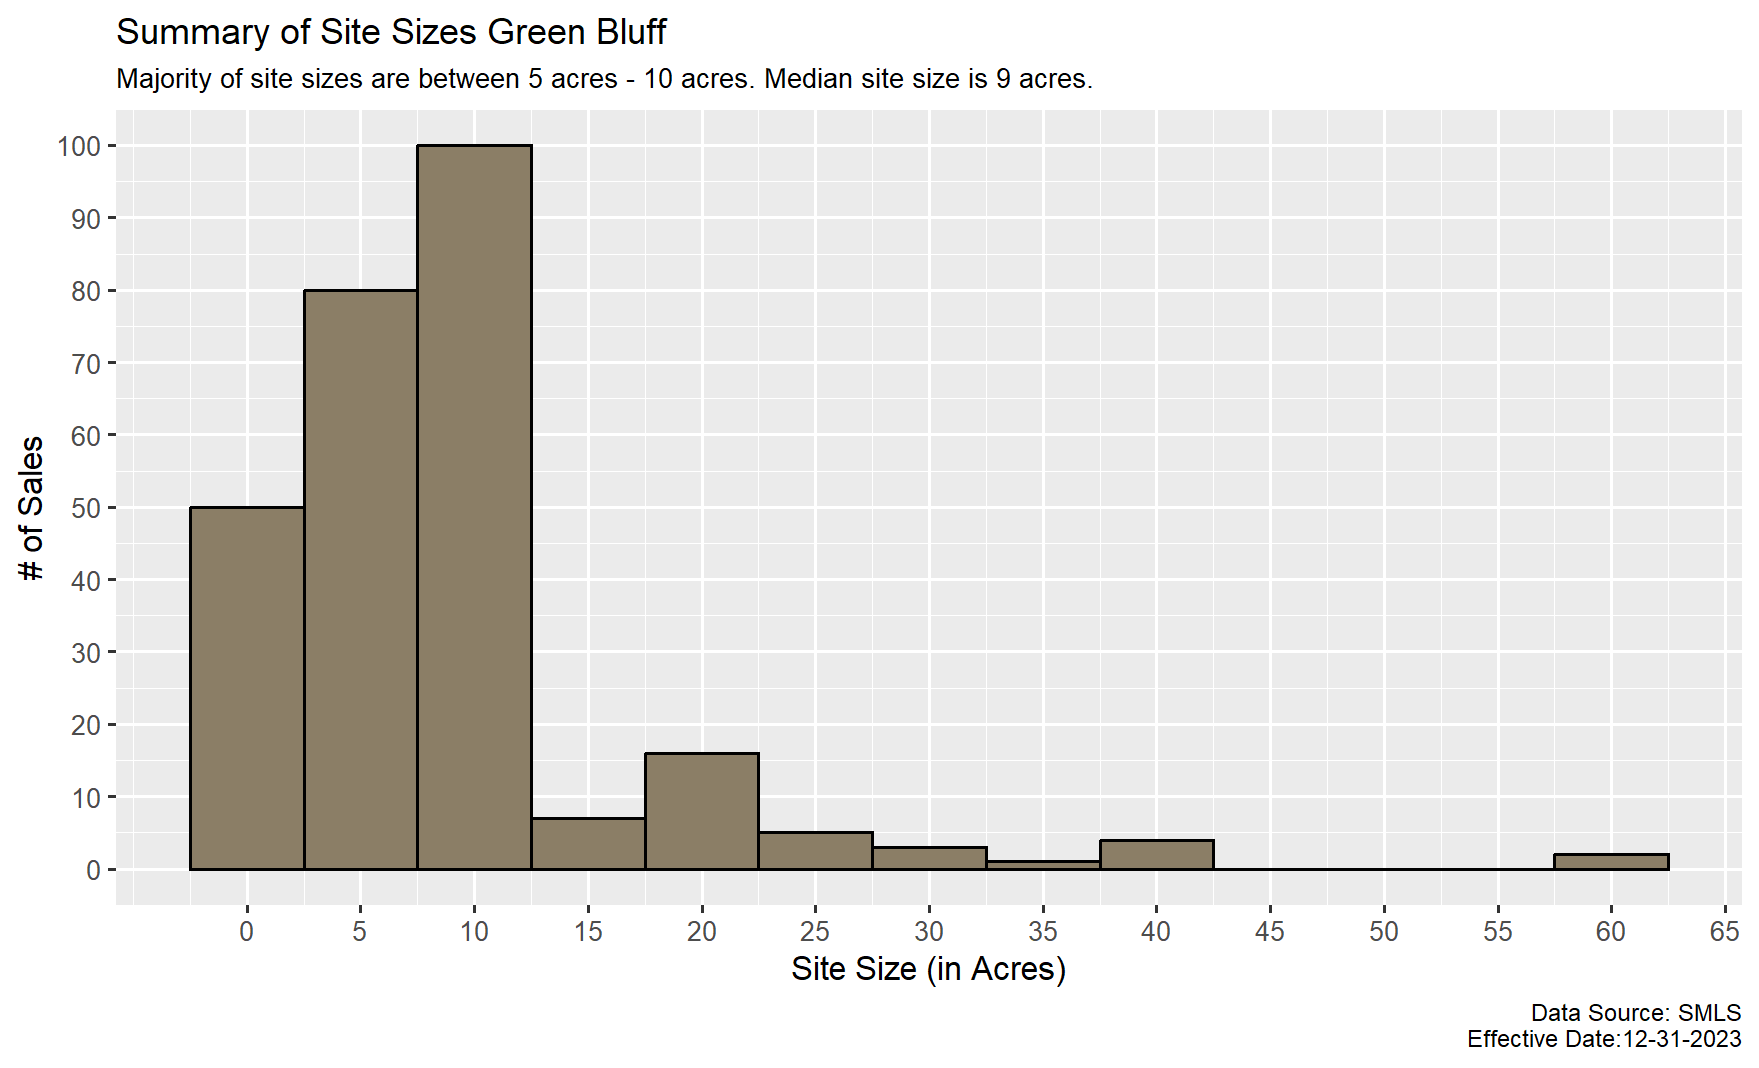
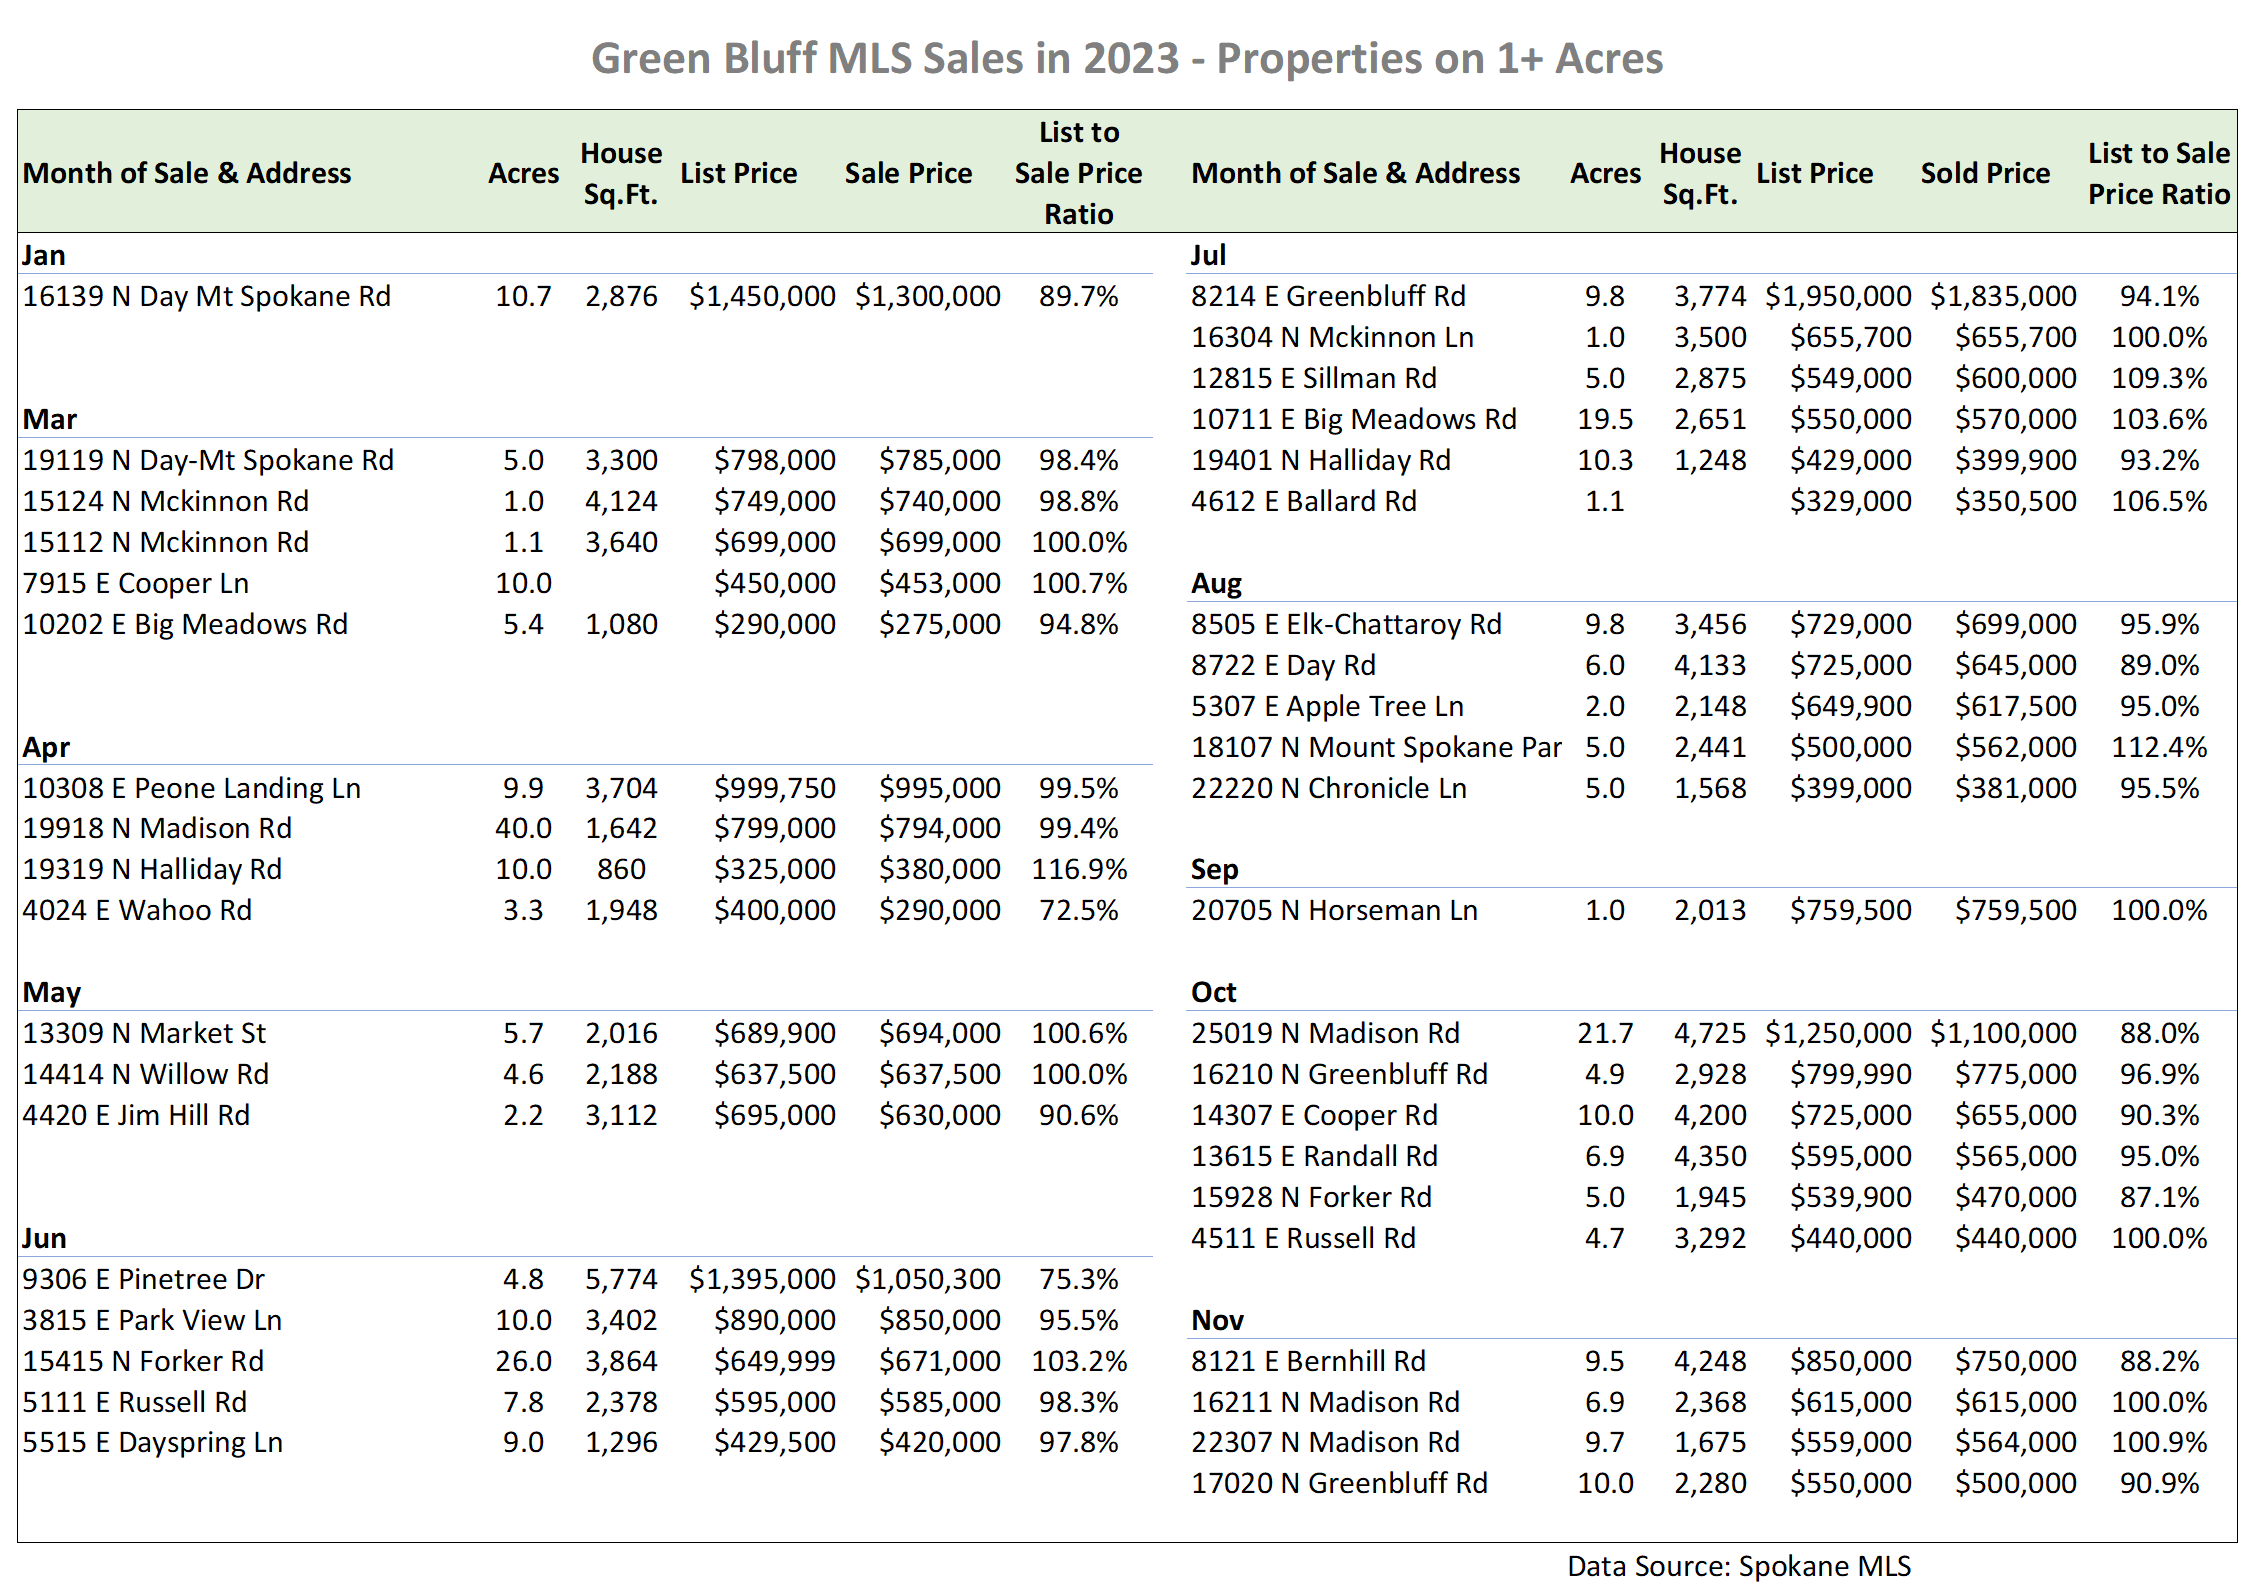
To better capture housing characteristics in the Green Bluff market, a survey over the last five years of SMLS sales on 1 acre or more was performed.
Site sizes range from 0 – 456 acres; the median site size is 2 acres. Most of the sites in this neighborhood are between 0 acres – 10 acres.
House Size Distribution
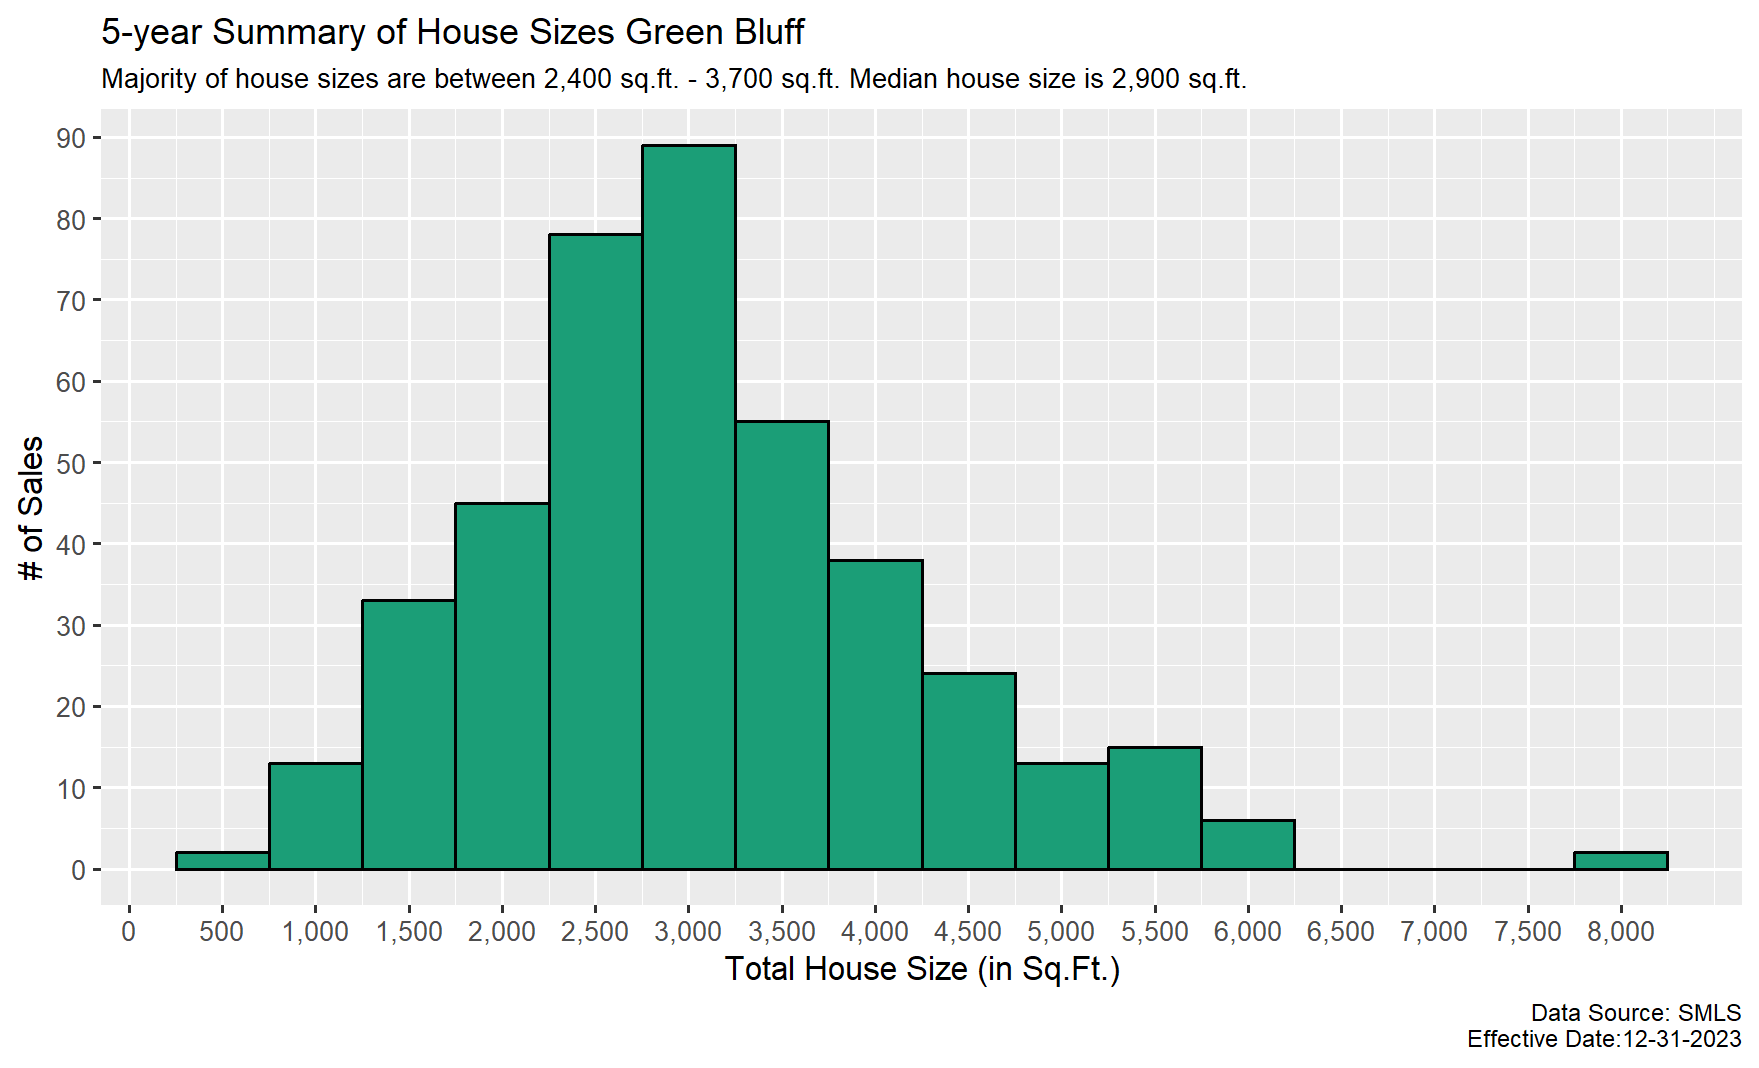
The smallest single-family sale was 320 sq.ft., and the largest was 8,010 sq. ft.; most ranged from 2,400 sq.ft. to 3,700 sq.ft.; the median house size is 2,900 sq.ft.
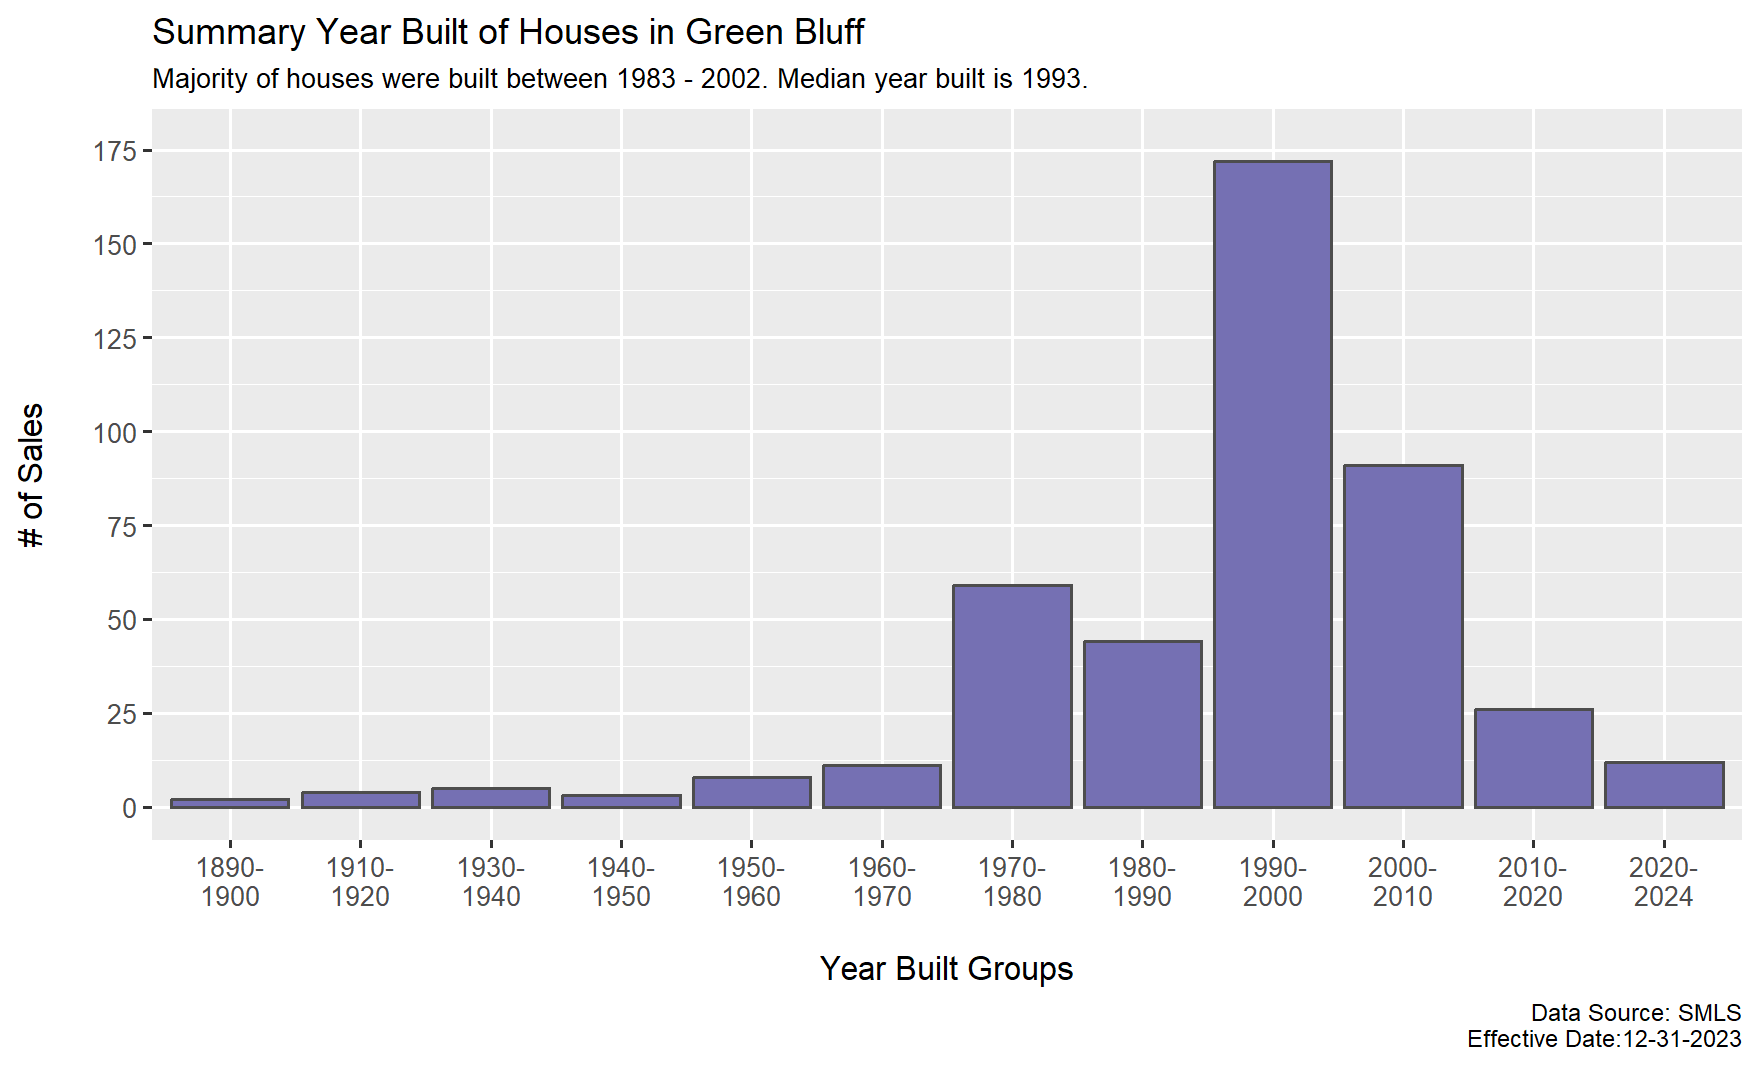
Year Built Distribution
Need a private appraisal for an estate valuation, separation agreement, or a private party sale?
Selling in 2024 and need to list your property for sale?
Call Cody Kerr
509.944.5071
Licensed Appraiser
Realtor/Agent
Expert in properties on acreage and Green Bluff Real Estate Specialist
End Notes
- https://fhaloans.guide/loan-limits/washington/spokane-county
- fred.stlouisfed.org


Leave a Reply